Note
Go to the end to download the full example code.
Equinoxes and Solstices#
Visualizes the transformation from ITRF to J2000 over the course of a day and at special points of the year, highlighting the importance of the spring equinox
import datetime

import numpy as np
import pyvista as pv

import mirage as mr
import mirage.vis as mrv
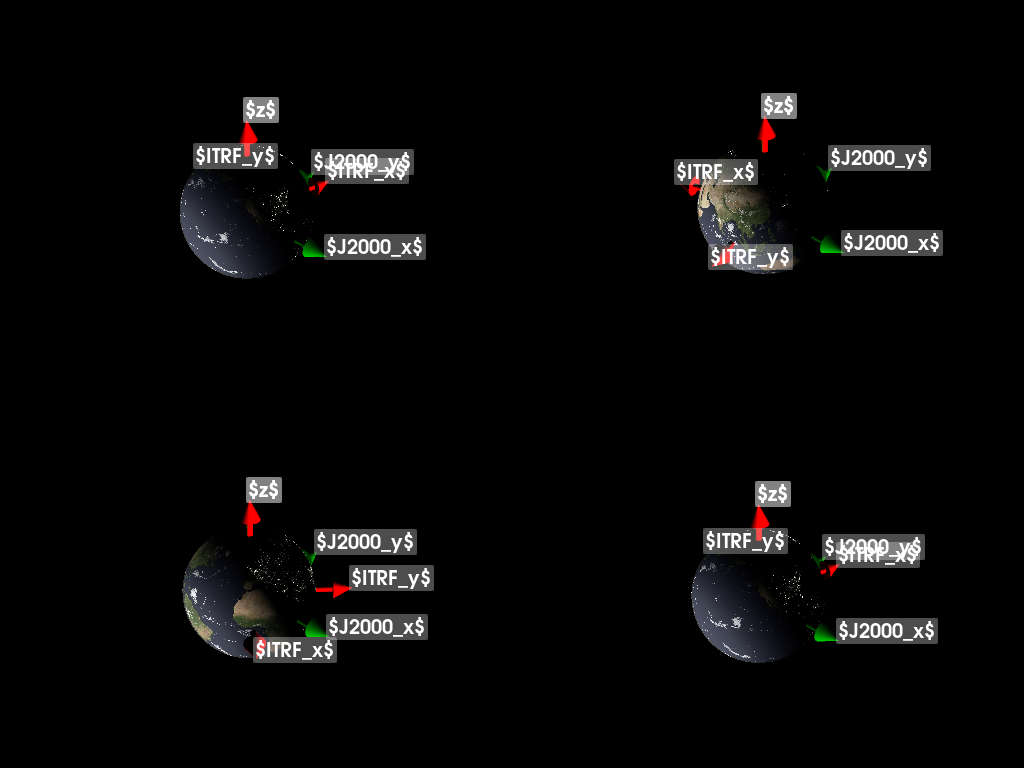
Let’s set up a space of dates over a single day
ntimes = 4
date = mr.utc(2023, 12, 9, 12)
bod = mr.beginning_of_day(date)
dspace = mr.date_linspace(bod, bod + datetime.timedelta(days=1), ntimes)
We can use mr.EarthFixedFrame to set up the coordinate frame transformation we are about.
frame_conversion = mr.EarthFixedFrame('itrf', 'j2000')
We can then plot the basis vectors at each of the selected times, labeling them in each subplot
def plot_bases_at_date(pl: pv.Plotter, d: datetime.datetime) -> None:
    pl.add_text(d.strftime('%Y-%m-%d %H:%M:%S UTC'))
    mrv.plot_earth(
        pl,
        mode='eci',
        date=d,
    )
    mrv.plot_basis(
        pl,
        frame_conversion.rotms_at_dates(d),
        color='r',
        labels=['$ITRF_x$', '$ITRF_y$', '$z$'],
        **label_kwargs,
    )

    mrv.plot_basis(
        pl,
        np.eye(3),
        color='g',
        labels=['$J2000_x$', '$J2000_y$', '$z$'],
        **label_kwargs,
    )


label_kwargs = {
    'shape_opacity': 0.3,
    'font_size': 20,
    'scale': 10e3,
}
pl = pv.Plotter(shape=(ntimes // 2, ntimes // 2))
for i, d in enumerate(dspace):
    pl.subplot(i // 2, i % 2)
    plot_bases_at_date(pl, d)
    pl.camera.position = (40e3, -40e3, 40e3)
pl.show()
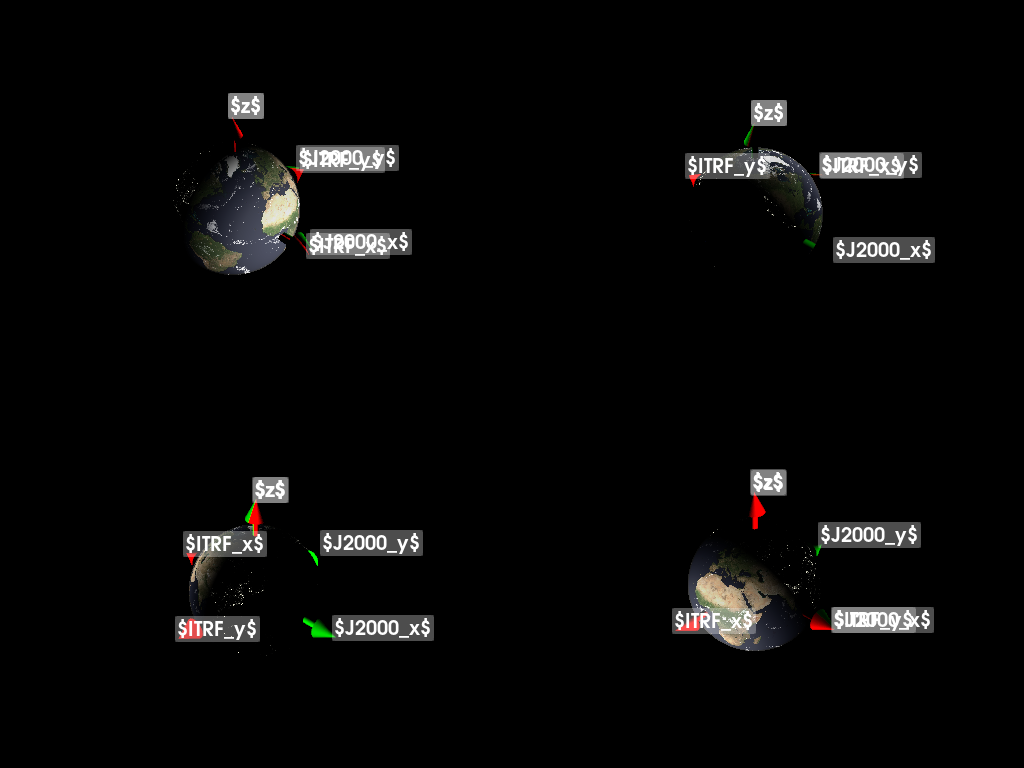
It’s easy to get confused about what the vernal equinox really is. Is it a time? Is it a direction? To dig into this, let’s look at the transformation between ITRF and J2000 at noon on the equinoxes and solstices
vernal_equinox = datetime.datetime(2023, 3, 19, 12, 0, 0, tzinfo=datetime.timezone.utc)
summer_solstice = datetime.datetime(2023, 6, 21, 12, 0, 0, tzinfo=datetime.timezone.utc)
autumnal_solstice = datetime.datetime(
    2023, 9, 23, 12, 0, 0, tzinfo=datetime.timezone.utc
)
winter_solstice = datetime.datetime(
    2023, 12, 21, 12, 0, 0, tzinfo=datetime.timezone.utc
)

important_dates = [
    vernal_equinox,
    summer_solstice,
    autumnal_solstice,
    winter_solstice,
]

pl = pv.Plotter(shape=(ntimes // 2, ntimes // 2))
for i, d in enumerate(important_dates):
    pl.subplot(i // 2, i % 2)
    plot_bases_at_date(pl, d)
    pl.camera.position = (40e3, -40e3, 40e3)
pl.show()
Total running time of the script: (0 minutes 12.478 seconds)