Note
Go to the end to download the full example code.
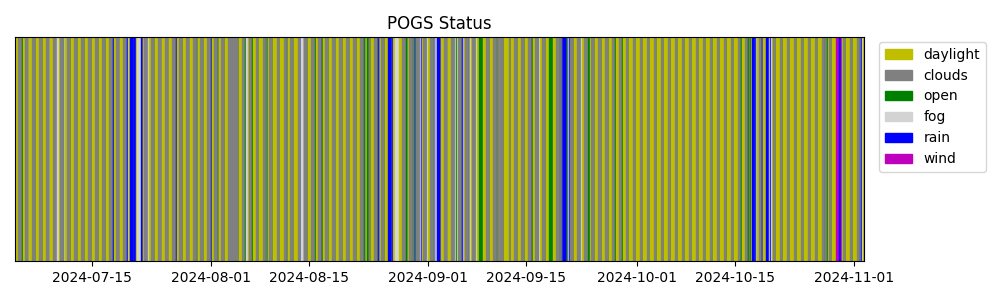
POGS Status#
The weather status of the Purdue Optical Ground Station
import datetime
import itertools
import os

import matplotlib.pyplot as plt

import mirage as mr  # noqa

with open(os.path.join(os.environ['DATADIR'], 'nmskies_state_changes.txt'), 'r') as f:
    csv = f.read()

vals = [x.split(',') for x in csv.split('\n')]
vals = [
    {'date': datetime.datetime.strptime(x[0], '%Y-%m-%d %H:%M:%S.%f'), 'status': x[1]}
    for x in vals[:-1]
]

cols = {
    'fog': 'lightgray',
    'clouds': 'gray',
    'rain': 'b',
    'open': 'g',
    'daylight': 'y',
    'wind': 'm',
}

seen = {}
plt.figure(figsize=(10, 3))
for pair in itertools.pairwise(vals):
    start_date = pair[0]['date']
    end_date = pair[1]['date']
    status = pair[1]['status']

    label = status if status not in seen else '_'
    plt.fill_between([start_date, end_date], 0, 1, color=cols[status], label=label)
    seen[status] = True

plt.yticks([])
plt.autoscale(enable=True, tight=True)
plt.title('POGS Status')
plt.legend(bbox_to_anchor=(1.01, 1.01))
plt.tight_layout()
plt.show()
Total running time of the script: (0 minutes 0.632 seconds)