Note
Go to the end to download the full example code.
Plotting Earth#
Plotting the Earth with a variety of options
import datetime

import numpy as np
import pyvista as pv

import mirage as mr
import mirage.vis as mrv

d0 = datetime.datetime(2022, 6, 4, 12, 0, 0, tzinfo=datetime.timezone.utc)
date_space_day = d0 + mr.days(np.linspace(0, 1, 50, endpoint=False))
Just so that the thumbnail of this example is exciting, let’s animate a full photorealistic Earth over the course of a day
pl = pv.Plotter()
pl.open_gif('earth_day.gif', fps=15)
for date in date_space_day:
    mrv.plot_earth(pl, date=date)
    pl.camera.position = (40e3, 0.0, 0.0)
    pl.write_frame()
pl.close()
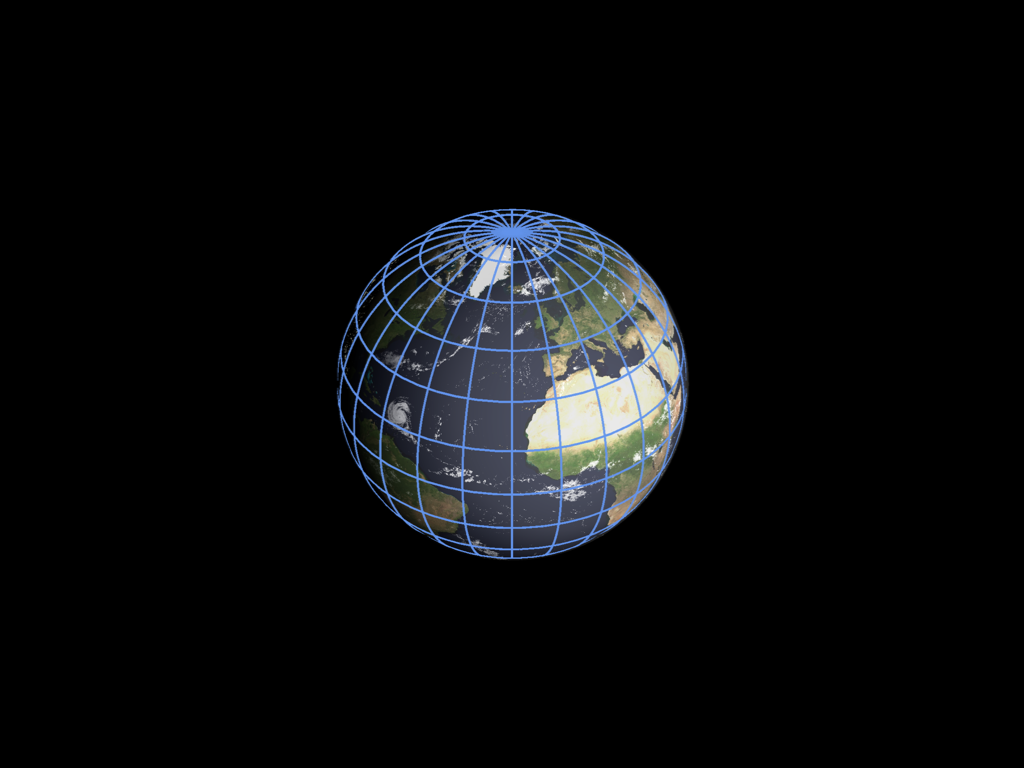
Night lights with latitude and longitude lines
pl = pv.Plotter()
mrv.plot_earth(
    pl,
    date=date,
)
grid = mrv.celestial_grid(15, 15)
mrv.plot3(
    pl,
    mr.AstroConstants.earth_r_eq * grid,
    color='cornflowerblue',
    line_width=5,
    lighting=False,
    opacity=0.2,
)
pl.show()
Total running time of the script: (0 minutes 19.894 seconds)