Note
Go to the end to download the full example code.
TLE Switching#
Various methods to switch between TLEs for more accurate long-term propagation
import matplotlib.pyplot as plt
import numpy as np
import pyvista as pv

import mirage as mr
import mirage.vis as mrv
Let’s use the SUPERBIRD 6 satellite
satdefs = mr.load_satdef_array()
satnum = satdefs.get_satnum_by_name('SUPERBIRD 6')
And propagate for the previous 30 days
base_date = mr.utc(2020, 1, 1)
dtimes, epsec_space = mr.date_linspace(
    base_date - mr.days(30), base_date, int(1e4), return_epsecs=True
)
- We can then propagate with three switching strategies:
closestchooses the closest TLE epoch to the current timenewestchooses the most previous recent TLE at each timeinterpchooses the most recent and next TLEs and linearly interpolates between their propogated positions
r_closest = mr.tle_propagate_with_switching(
    satnum, dtimes, switch_strategy='closest', frame='itrf'
)
r_interp = mr.tle_propagate_with_switching(
    satnum, dtimes, switch_strategy='interp', frame='itrf'
)
r_newest = mr.tle_propagate_with_switching(
    satnum, dtimes, switch_strategy='newest', frame='itrf'
)
We can plot these trajectories to show that they result in similar trajectories
pl = pv.Plotter()
mrv.plot_earth(pl, date=dtimes[0], mode='eci')
lw = 6
mrv.plot3(pl, r_closest, color='c', lighting=False, line_width=lw)
# mrv.plot3(pl, r_newest, color="m", lighting=False, line_width=lw)
# mrv.plot3(pl, r_interp, color="lime", lighting=False, line_width=lw)
mid_point = r_interp[r_interp.shape[0] // 2, :]
pl.camera.focal_point = mid_point
pl.camera.position = (np.linalg.norm(mid_point) + 100_000) * (
    mr.hat(mid_point) + np.array([0.0, 0.0, 0.4])
)
pl.show()

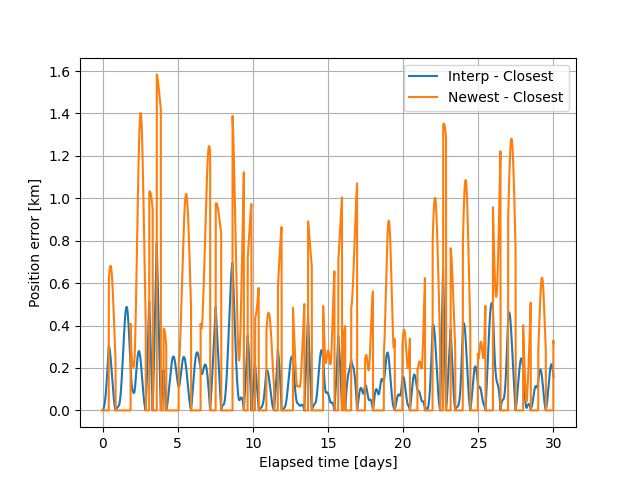
We can also plot the error between these switching methods. Clearly, the interpolated switching strategy is the most accurate choice
plt.plot(epsec_space / 86400, mr.vecnorm(r_interp - r_closest))
plt.plot(epsec_space / 86400, mr.vecnorm(r_newest - r_closest))
plt.xlabel('Elapsed time [days]')
plt.ylabel('Position error [km]')
plt.legend(['Interp - Closest', 'Newest - Closest'])
plt.grid()
plt.show()
Total running time of the script: (0 minutes 2.855 seconds)