Note
Go to the end to download the full example code.
Types of Light Curves#
Plotting light curves for a variety of object types and attitude profiles
# isort: off
import datetime
from typing import Any
import matplotlib.pyplot as plt
import numpy as np
import pyvista as pv
from matplotlib.animation import FuncAnimation
import mirage as mr
import mirage.vis as mrv
from PIL import Image
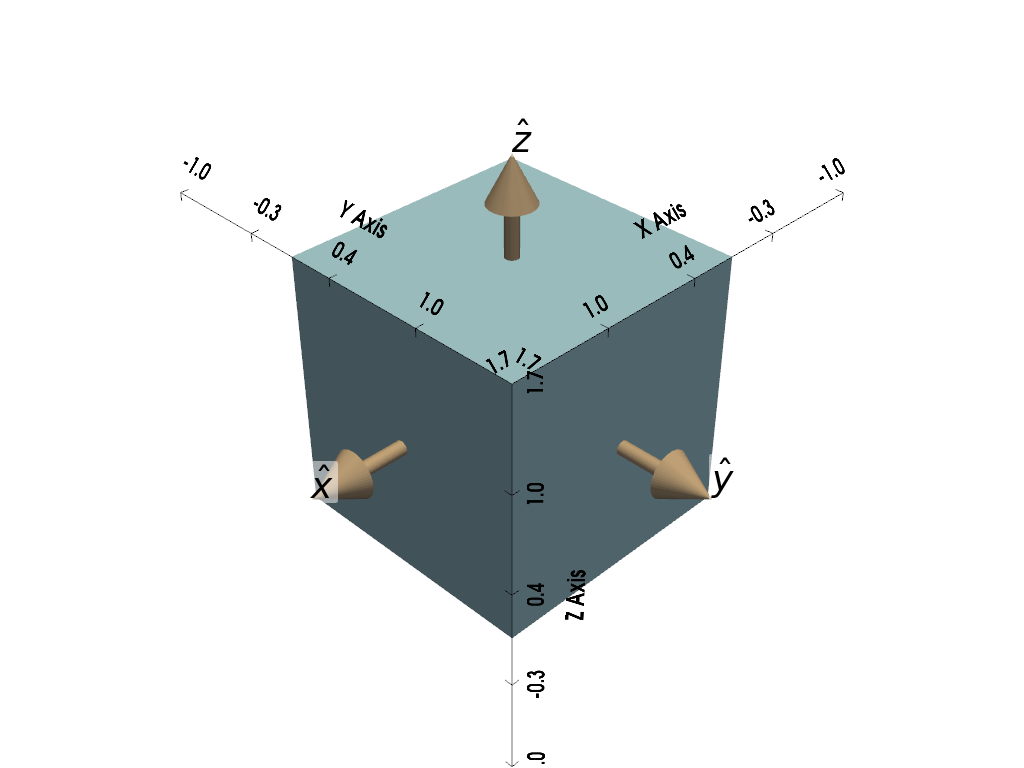
Case 1: The light curve of a cube
integration_time_s = 1.0 # seconds
obj = mr.SpaceObject('cube.obj', identifier='GOES 15')
pl = pv.Plotter()
mrv.render_spaceobject(pl, obj)
mrv.plot_basis(
pl,
np.eye(3),
labels=['$\hat{x}$', '$\hat{y}$', '$\hat{z}$'],
scale=np.max(mr.vecnorm(obj.v)),
shape_opacity=0.5,
)
pl.show_bounds()
pl.show()
Setup
station = mr.Station(preset='pogs')
brdf = mr.Brdf(name='phong', cd=0.7, cs=0.3, n=5)
attitude = mr.RbtfAttitude(
w0=0.1 * mr.hat(np.array([[1.0, 2.0, 1.0]])),
q0=np.array([0.0, 0.0, 0.0, 1.0]),
itensor=np.diag([1.0, 2.0, 3.0]),
)
idate = mr.utc(2023, 3, 26, 5)
dates, epsecs = mr.date_arange(
idate, idate + mr.minutes(1), mr.seconds(1), return_epsecs=True
)
print(attitude.w0)
print(idate)
[0.04082483 0.08164966 0.04082483]
2023-03-26 05:00:00+00:00
Determining inertial positions of the Sun, observer, and object
r_obj_j2k = obj.propagate(dates)
sv = mr.sun(dates)
ov = station.j2000_at_dates(dates)
svi = sv - r_obj_j2k
ovi = ov - r_obj_j2k
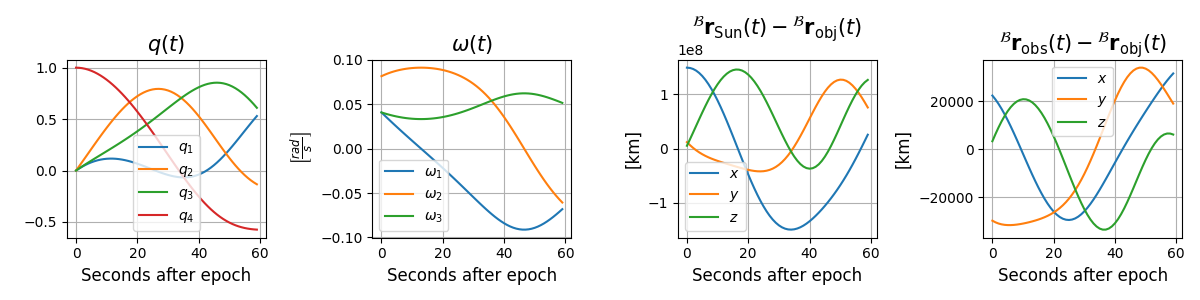
Plotting the spin and orientation over time
q_of_t, w_of_t = attitude.propagate(epsecs)
dcms_of_t = mr.quat_to_dcm(q_of_t)
svb = mr.stack_mat_mult_vec(dcms_of_t, svi)
ovb = mr.stack_mat_mult_vec(dcms_of_t, ovi)
plt.figure(figsize=(12, 3))
plt.subplot(1, 4, 1)
plt.plot(epsecs, q_of_t)
mrv.texit('$q(t)$', 'Seconds after epoch', '', ['$q_1$', '$q_2$', '$q_3$', '$q_4$'])
plt.subplot(1, 4, 2)
plt.plot(epsecs, w_of_t)
mrv.texit(
'$\omega(t)$',
'Seconds after epoch',
r'$\left[ \frac{rad}{s} \right]$',
['$\omega_1$', '$\omega_2$', '$\omega_3$'],
)
plt.subplot(1, 4, 3)
plt.plot(epsecs, svb)
mrv.texit(
'${}^{\mathcal{B}}\mathbf{r}_{\mathrm{Sun}}(t) - {}^{\mathcal{B}}\mathbf{r}_{\mathrm{obj}}(t)$',
'Seconds after epoch',
'[km]',
['$x$', '$y$', '$z$'],
)
plt.subplot(1, 4, 4)
plt.plot(epsecs, ovb)
mrv.texit(
'${}^{\mathcal{B}}\mathbf{r}_{\mathrm{obs}}(t) - {}^{\mathcal{B}}\mathbf{r}_{\mathrm{obj}}(t)$',
'Seconds after epoch',
'[km]',
['$x$', '$y$', '$z$'],
)
plt.tight_layout()
# plt.show()
svb = mr.hat(svb)
ovb = mr.hat(ovb)
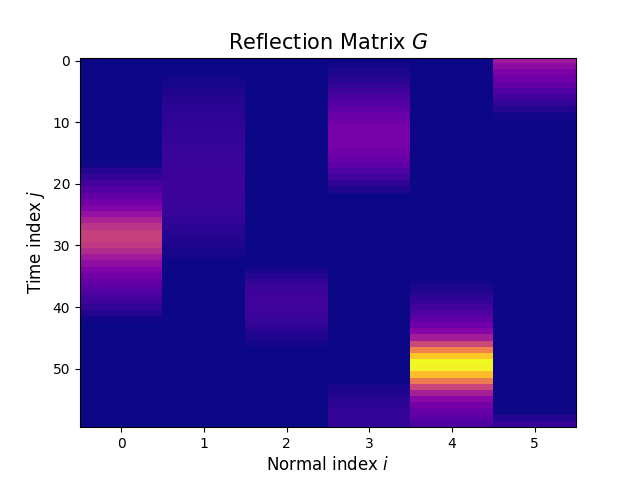
Plotting the reflection matrix
G = brdf.compute_reflection_matrix(svb, ovb, obj.unique_normals)
lc = G @ obj.unique_areas
plt.imshow(G, cmap='plasma', aspect='auto', interpolation='none')
mrv.texit('Reflection Matrix $G$', 'Normal index $i$', 'Time index $j$', grid=False)
# plt.show()
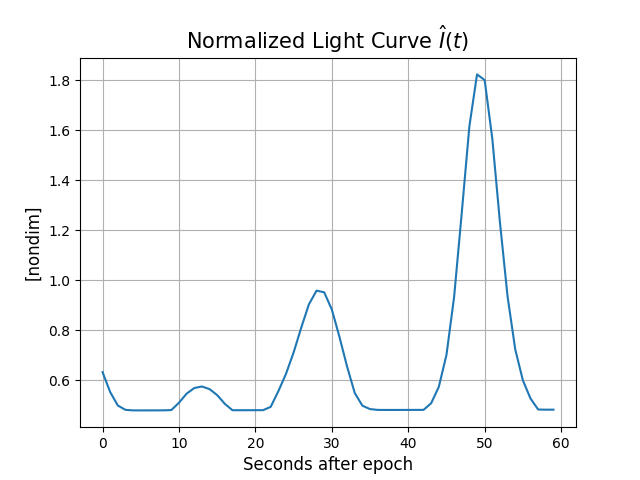
Plotting the light curve
plt.plot(epsecs, lc)
mrv.texit('Normalized Light Curve $\hat{I}(t)$', 'Seconds after epoch', '[nondim]')
# plt.show()
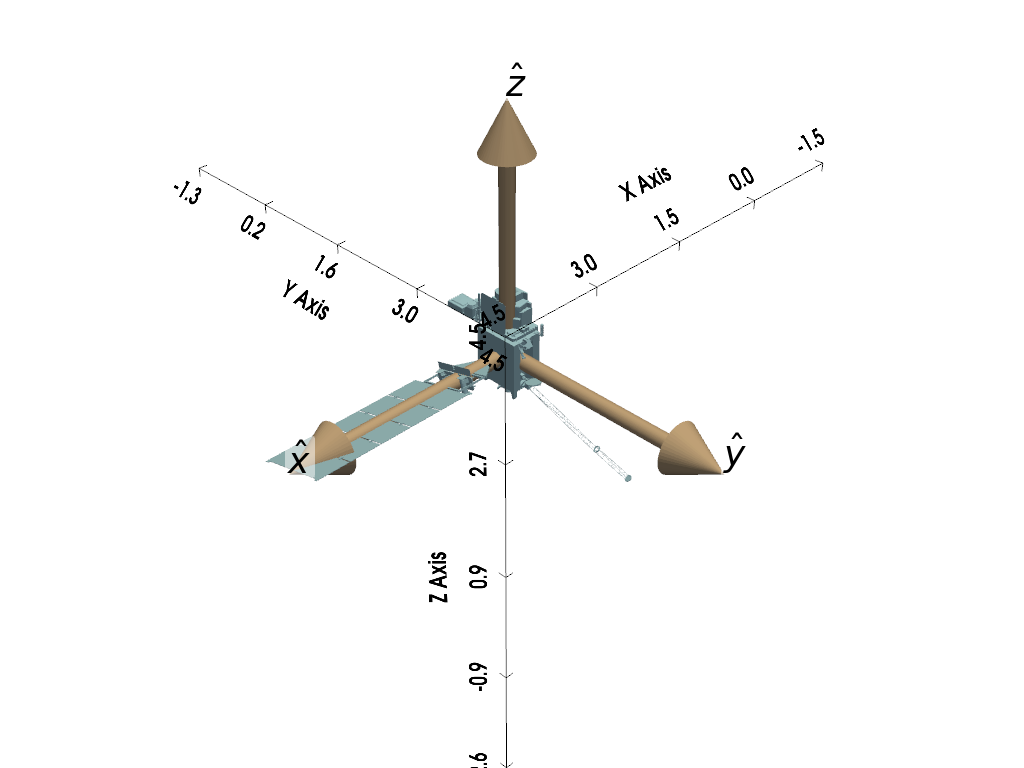
Case 2: a box-wing
obj = mr.SpaceObject('matlib_goes17.obj', identifier=26360)
msf = 0.1
pl = pv.Plotter()
mrv.render_spaceobject(pl, obj)
mrv.plot_basis(
pl,
np.eye(3),
labels=['$\hat{x}$', '$\hat{y}$', '$\hat{z}$'],
scale=np.max(mr.vecnorm(obj.v)),
shape_opacity=0.5,
)
pl.show_bounds()
# pl.show()
<CubeAxesActor(0x139d09a00) at 0x3272e7460>
Setup
station = mr.Station(preset='pogs')
station.constraints = [
mr.SnrConstraint(3),
mr.ElevationConstraint(15),
mr.TargetIlluminatedConstraint(),
mr.ObserverEclipseConstraint(station),
mr.MoonExclusionConstraint(30),
]
brdf = mr.Brdf(name='phong')
attitude = mr.RbtfAttitude(
w0=0.01 * mr.hat(np.array([[1.0, 0.0, 1.0]])),
q0=np.array([0.0, 0.0, 0.0, 1.0]),
itensor=np.diag([1.0, 2.0, 2.0]),
)
idate = mr.utc(2022, 12, 9, 8)
dates, epsecs = mr.date_arange(
idate, idate + mr.minutes(30), mr.seconds(10), return_epsecs=True
)
print(idate)
print(attitude.w0)
2022-12-09 08:00:00+00:00
[0.00707107 0. 0.00707107]
Determining inertial positions of the Sun, observer, and object
r_obj_j2k = obj.propagate(dates)
sv = mr.sun(dates)
ov = station.j2000_at_dates(dates)
svi = sv - r_obj_j2k
ovi = ov - r_obj_j2k
# pl = pv.Plotter()
# mrv.render_observation_scenario(pl, dates, station, mr.hat(-ovi), sensor_extent_km=36e3, night_lights=True)
# pl.show()
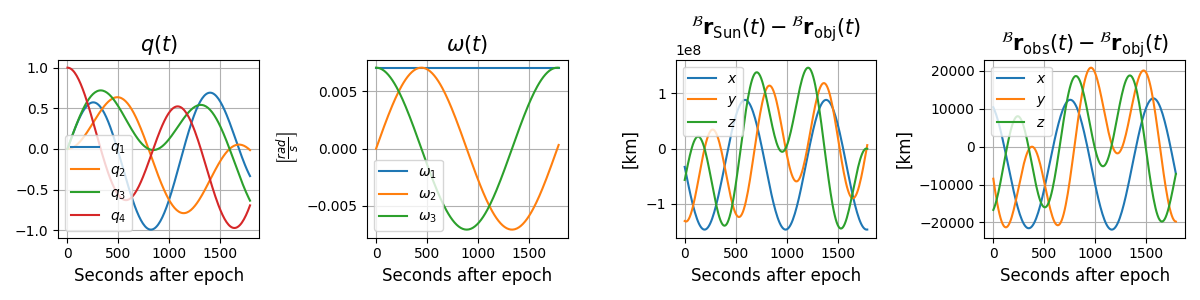
Plotting the spin and orientation over time
q_of_t, w_of_t = attitude.propagate(epsecs)
dcms_of_t = mr.quat_to_dcm(q_of_t)
svb = mr.stack_mat_mult_vec(dcms_of_t, svi)
ovb = mr.stack_mat_mult_vec(dcms_of_t, ovi)
plt.figure(figsize=(12, 3))
plt.subplot(1, 4, 1)
plt.plot(epsecs, q_of_t)
mrv.texit('$q(t)$', 'Seconds after epoch', '', ['$q_1$', '$q_2$', '$q_3$', '$q_4$'])
plt.subplot(1, 4, 2)
plt.plot(epsecs, w_of_t)
mrv.texit(
'$\omega(t)$',
'Seconds after epoch',
r'$\left[ \frac{rad}{s} \right]$',
['$\omega_1$', '$\omega_2$', '$\omega_3$'],
)
plt.subplot(1, 4, 3)
plt.plot(epsecs, svb)
mrv.texit(
'${}^{\mathcal{B}}\mathbf{r}_{\mathrm{Sun}}(t) - {}^{\mathcal{B}}\mathbf{r}_{\mathrm{obj}}(t)$',
'Seconds after epoch',
'[km]',
['$x$', '$y$', '$z$'],
)
plt.subplot(1, 4, 4)
plt.plot(epsecs, ovb)
mrv.texit(
'${}^{\mathcal{B}}\mathbf{r}_{\mathrm{obs}}(t) - {}^{\mathcal{B}}\mathbf{r}_{\mathrm{obj}}(t)$',
'Seconds after epoch',
'[km]',
['$x$', '$y$', '$z$'],
)
plt.tight_layout()
plt.show()
Plotting the light curve
lc, aux_data = station.observe_light_curve(
obj,
attitude,
brdf,
dates,
integration_time_s=integration_time_s,
use_engine=True,
model_scale_factor=msf,
save_imgs=True,
instances=1,
)
imgs = []
for i in range(len(dates)):
imgs.append(2 * np.array(Image.open(f'out/frame{i + 1}.png'))[:, :, 0])
save a gif animation of the images in the out/ directory
fig = plt.figure(figsize=(10, 4))
plt.subplot(1, 2, 1)
im = plt.imshow(imgs[0], cmap='gray')
mrv.texit('Rendered Scene', '', '')
plt.xticks([])
plt.yticks([])
plt.subplot(1, 2, 2)
lci = lc().filled(np.nan)
plt.plot(epsecs, lci)
plt.yscale('log')
pt = plt.scatter(epsecs[0], lci[0], color='r')
plt.gca().set_aspect('auto')
mrv.texit('Light Curve $I(t)$', 'Seconds after epoch', '[ADU]')
def animate(i):
im.set_data(imgs[i])
pt.set_offsets((epsecs[i], lci[i]))
return im, pt
frames = len(dates)
anim_time = 10
fps = frames / anim_time
interval = 1000 / fps
anim = FuncAnimation(fig, animate, frames=frames, interval=interval, blit=True)
anim.save('out/animation.gif')
lcs = np.array([lc() for i in range(1000)])
mean_lcs = np.mean(lcs, axis=0)
var_lcs = np.var(lcs, axis=0)
for stdev in [1, 2, 3]:
plt.fill_between(
epsecs,
mean_lcs - (stdev - 1) * np.sqrt(var_lcs),
mean_lcs - stdev * np.sqrt(var_lcs),
alpha=0.4 - 0.1 * stdev,
color='b',
edgecolor=None,
label=f'{stdev}$\sigma$',
)
plt.fill_between(
epsecs,
mean_lcs + (stdev - 1) * np.sqrt(var_lcs),
mean_lcs + stdev * np.sqrt(var_lcs),
alpha=0.4 - 0.1 * stdev,
color='b',
edgecolor=None,
)
plt.plot(epsecs, mean_lcs, lw=1, color='k', label='Mean')
plt.yscale('log')
mrv.texit('Light Curve $I(t)$', 'Seconds after epoch', '[ADU]')
plt.legend()
plt.show()