Note
Go to the end to download the full example code.
Fitting Poisson Variables#
Fitting a random Poisson-distributed process to a set of data
import matplotlib.pyplot as plt
import numpy as np
import seaborn as sns
from scipy.stats import poisson

import mirage as mr

data_to_fit = np.random.poisson(3, int(1e5))  # Simulated Poisson data with lambda = 5
lambda_est = mr.fit_poisson_process(data_to_fit)

print(f'Estimated rate parameter: {lambda_est}')

x_plot = np.arange(0, 15)

sns.histplot(data_to_fit, stat='density', binwidth=1)
sns.histplot(poisson(lambda_est).rvs(data_to_fit.size), stat='density', binwidth=1)

plt.show()
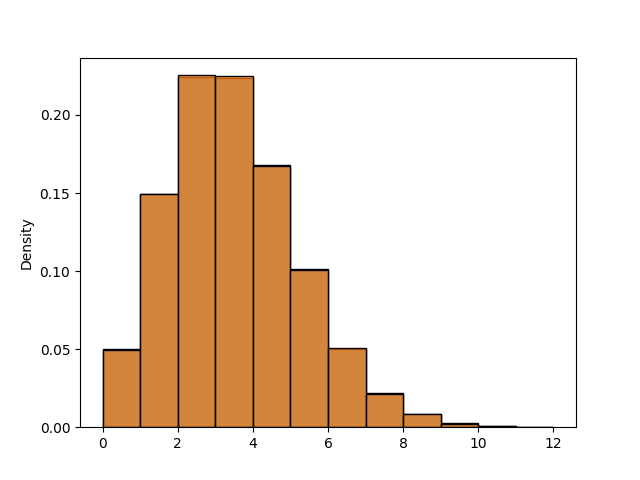
Estimated rate parameter: 3.00043
Expected absolute error in a sample should be equal to the standard deviation
print(f'Expected standard deviation: {np.sqrt(lambda_est)}')
print(f'Sample standard deviation: {np.std(data_to_fit)}')
Expected standard deviation: 1.7321749334290693
Sample standard deviation: 1.734084719700857
Total running time of the script: (0 minutes 0.259 seconds)