Note
Go to the end to download the full example code.
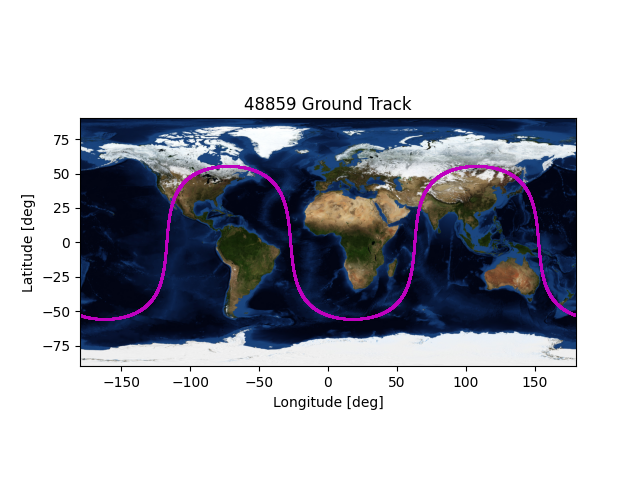
Ground Tracks#
Plots the ground track for a GPS satellite
import os

import matplotlib.pyplot as plt
import numpy as np
from PIL import Image

import mirage as mr
Let’s set up a space of dates to operate on
dates = mr.date_linspace(mr.now(), mr.now() + mr.days(1.0), 8640) - mr.days(100)
And propagate one of the NAVSTAR satellites to all the dates
obj = mr.SpaceObject('cube.obj', identifier='NAVSTAR 81 (USA 319)')
r_eci = obj.propagate(dates)
Converting the propagated result into ECEF, then LLA
r_ecef = mr.stack_mat_mult_vec(mr.j2000_to_itrf(dates), r_eci)
lla = mr.itrf_to_lla(r_ecef)
Finally, plotting the resulting Earth-fixed trajectory with the Earth in the background
im = Image.open(
    os.path.join(os.environ['TEXDIR'], 'world.topo.bathy.200412.3x5400x2700.jpg')
)
plt.imshow(im, extent=(-180, 180, -90, 90))
plt.scatter(np.rad2deg(lla[1]), np.rad2deg(lla[0]), s=1, c='m')
plt.title(f'{obj.sat.satnum} Ground Track')
plt.xlabel('Longitude [deg]')
plt.ylabel('Latitude [deg]')
plt.show()
Total running time of the script: (0 minutes 2.844 seconds)