Note
Go to the end to download the full example code.
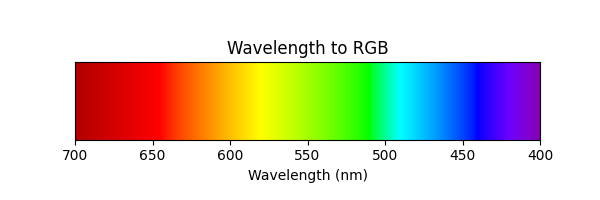
Wavelength to RGB#
An approximate conversion from wavelength to RGB values for plotting.
import matplotlib.pyplot as plt
import numpy as np

import mirage.vis as mrv

wavelengths = np.linspace(400, 700, 1000)
rgbs = mrv.wavelength_to_rgb(wavelengths).reshape(1, -1, 3)


plt.figure(figsize=(6, 2))
plt.imshow(rgbs, extent=[wavelengths.min(), wavelengths.max(), 0, 50])
plt.yticks([])
plt.xlabel('Wavelength (nm)')
plt.title('Wavelength to RGB')
plt.gca().invert_xaxis()
plt.show()


def srgb_transfer(rgb):
    srgb_lo = rgb * 12.92
    srgb_hi = 1.055 * rgb ** (1 / 2.4) - 0.055
    SRGB = (rgb > 0.0031308) * srgb_hi + (rgb <= 0.0031308) * srgb_lo
    return SRGB


def srgb_transfer_inverse(srgb):
    rgb_lo = srgb / 12.92
    rgb_hi = ((srgb + 0.055) / 1.055) ** 2.4
    linearRGB = (srgb > 0.04045) * rgb_hi + (srgb < 0.04045) * rgb_lo
    return linearRGB
Total running time of the script: (0 minutes 0.053 seconds)