Note
Go to the end to download the full example code.
Space Weather#
Plotting the \(K_p\), \(A_p\), and F10.7 space weather indices
import datetime
import os

import matplotlib.pyplot as plt
import pandas as pd

import mirage as mr
import mirage.vis as mrv
Loading the space weather file and extracting the dates and indices
urls_and_dirs = {
    'https://celestrak.org/SpaceData/SW-Last5Years.csv': os.environ['DATADIR']
}

for url, dir in urls_and_dirs.items():
    mr.save_file_from_url(url, dir)

sw_file_path = os.path.join(os.environ['DATADIR'], 'SW-Last5Years.csv')
sw_df = pd.read_csv(sw_file_path, header=0)
dates = [datetime.datetime.strptime(x, '%Y-%m-%d') for x in sw_df['DATE']]
f107_1au = sw_df['F10.7_ADJ']
f107_obs = sw_df['F10.7_OBS']
ap = sw_df['AP_AVG']
kp = sw_df['KP_SUM']
SW-Last5Years.csv |████████████████████████████████████████| 257772/257772 [100%] in 0.3s (946974.56/s)
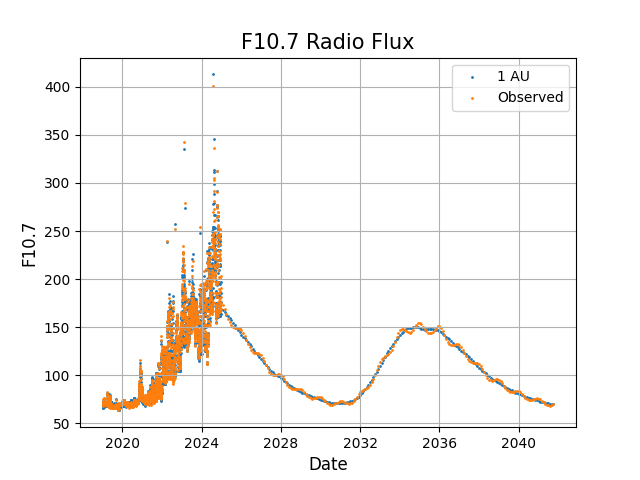
Plotting F10.7 radio flux
plt.scatter(dates, f107_1au, s=1)
plt.scatter(dates, f107_obs, s=1)
mrv.texit('F10.7 Radio Flux', 'Date', 'F10.7', ['1 AU', 'Observed'])
plt.show()
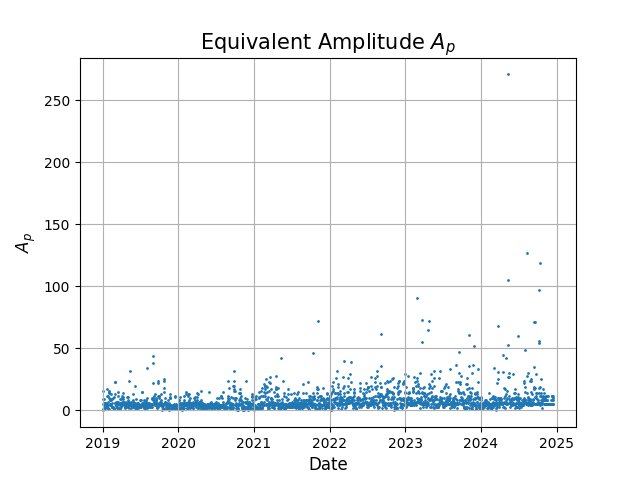
Plotting the geomagnetic index \(K_p\)
plt.scatter(dates, ap, s=1)
mrv.texit('Equivalent Amplitude $A_p$', 'Date', '$A_p$')
plt.show()
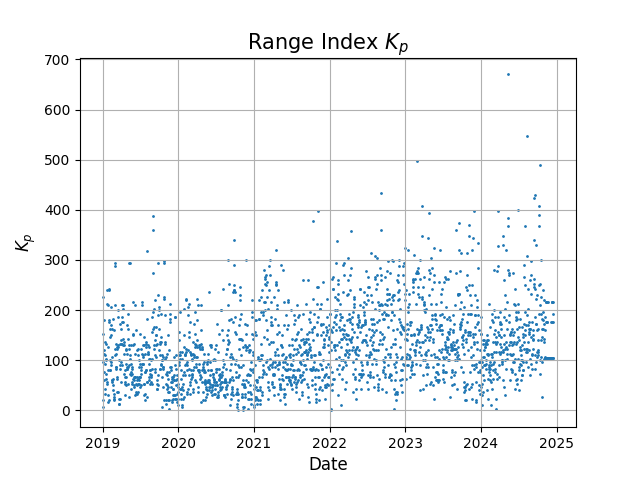
Plotting the geomagnetic index \(K_p\)
plt.scatter(dates, kp, s=1)
mrv.texit('Range Index $K_p$', 'Date', '$K_p$')
plt.show()
Reference for the CSV format found at CelesTrak
Total running time of the script: (0 minutes 1.379 seconds)