Note
Go to the end to download the full example code.
Zenith Light Pollution#
Plotting and querying a large dataset of zenith light pollution from the Light Pollution Map, with the raw file found here
import os

import matplotlib.pyplot as plt
import numpy as np
import rasterio

import mirage as mr
import mirage.vis as mrv
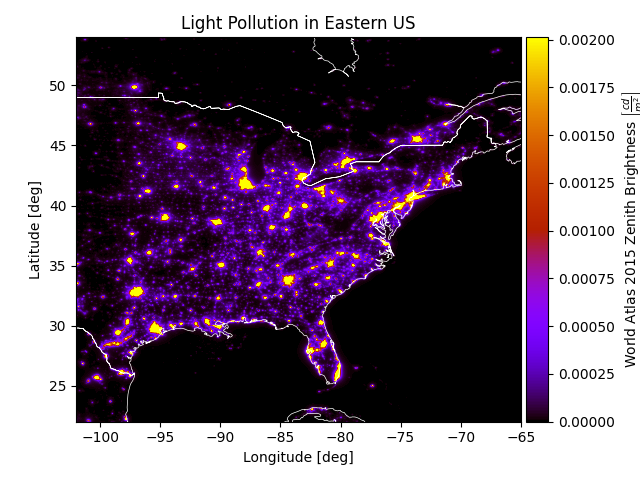
Let’s plot the zenith sky radiances as reported by the World Atlas 2015 dataset.
data_file = os.path.join(os.environ['DATADIR'], 'World_Atlas_2015.tif')

if not os.path.exists(data_file):
    mr.save_file_from_url(
        'https://filebin.net/v3ja2gt5jrifqsc6/World_Atlas_2015.zip',
        os.environ['DATADIR'],
    )

# from scipy.optimize import fsolve
# x = 0.171168465
# f = lambda lam_nm: mr.mcd_per_cm2_to_mpsas(x, lam_nm=lam_nm)-22
# print(fsolve(f, x0=474))

mcd_per_m2 = 0.171168465  # corresponds to mpsas=22

print(mr.mcd_per_m2_to_mpsas(mcd_per_m2))
print(mr.mpsas_to_mcd_per_m2(22))
print(mr.mpsas_to_mcd_per_m2(17.88))
print(mr.mcd_m2_to_watt_m2_sr(mcd_per_m2))
print(mr.candela_to_watt_per_sr(mcd_per_m2 / 1e3, lambdas=473.74960958))
print(mr.mpsas_to_irradiance_per_steradian(22))


print(-2.5 * np.log10(0.171 / 108000000))
print(108000000 * 10 ** (-22 / 2.5))

print(108000000 / 3600**2)
print(mr.AstroConstants.steradian_to_arcsecond2)

assert mr.candela_to_watt_per_sr(mr.watt_per_sr_to_candela(0.5)) == 0.5

with rasterio.open(data_file, 'r') as f:
    mr.tic()
    art_brightness = f.read().squeeze()  # mcd / m^2
    mr.toc()
    art_brightness_cd = art_brightness / 1e3

    artifical_radiance_spectrum = mr.candela_to_watt_per_sr(
        art_brightness_cd, lambdas=473.74960958
    )  # w / m^2 / sr

z = art_brightness_cd
21.999999999847013
0.17116846497588067
7.610685153296766
2.507478397620592e-07
1.6978902502946653e-06
1.697890250055416e-06
22.001069112736992
0.17116846478579997
8.333333333333334
42545170296.15221
Elapsed time: 1.41e+00 seconds
Plotting zenith light pollution in MPSAS
plt.xlim(-102, -65)
plt.ylim(22, 54)
plt.xlabel('Longitude [deg]')
plt.ylabel('Latitude [deg]')
mrv.plot_map_with_grid(
    z,
    'Light Pollution in Eastern US',
    r'World Atlas 2015 Zenith Brightness $\left[\frac{cd}{m^2}\right]$',
    cmap=plt.get_cmap('gnuplot'),
    borders=True,
    border_color='w',
    extent=(-180, 180, -60, 85),
    set_plot_size=False,
)
plt.clim(*np.percentile(z, [0.1, 99.9]))
plt.show()
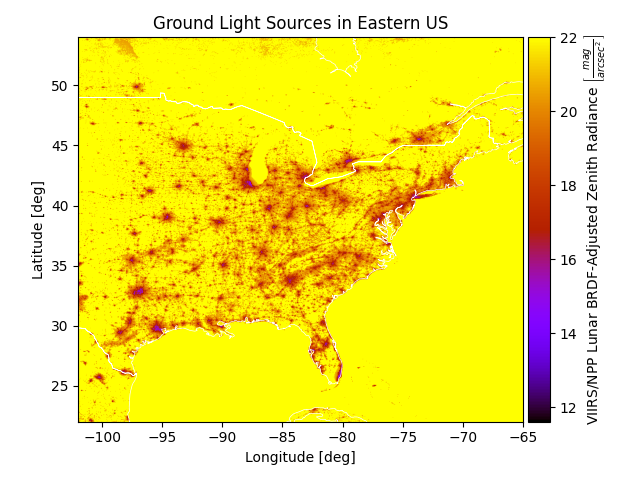
Let’s plot the ground-level radiances as observed by the VIIRS satellite
data_file = os.path.join(os.environ['DATADIR'], 'viirs_2022_raw.tif')

if not os.path.exists(data_file):
    mr.save_file_from_url(
        'ps://www2.lightpollutionmap.info/data/viirs_2022_raw.zip',
        os.environ['DATADIR'],
    )

with rasterio.open(data_file, 'r') as f:
    mr.tic()
    x = f.read().squeeze()  # nW / cm^2 / sr
    mr.toc()
    x = x[::10, ::10] * 1e-9  # W / cm^2 / sr
    x[np.isinf(np.abs(x))] = np.nan
    x *= 1e4  # W / m^2 / sr
    x = mr.irradiance_to_apparent_magnitude(
        x / mr.AstroConstants.steradian_to_arcsecond2
    )  # mag / arcsec^2
    x[np.isnan(x) | np.isinf(x)] = 22.0
Elapsed time: 1.69e+01 seconds
Plotting ground light pollution sources
plt.xlim(-102, -65)
plt.ylim(22, 54)
plt.xlabel('Longitude [deg]')
plt.ylabel('Latitude [deg]')
mrv.plot_map_with_grid(
    x,
    'Ground Light Sources in Eastern US',
    r'VIIRS/NPP Lunar BRDF-Adjusted Zenith Radiance $\left[\frac{mag}{arcsec^2}\right]$',
    cmap=plt.get_cmap('gnuplot'),
    borders=True,
    border_color='w',
    extent=(-180, 180, -65, 75),
    set_plot_size=False,
)
plt.show()
Total running time of the script: (0 minutes 47.353 seconds)