Note
Go to the end to download the full example code.
Global Elevation#
Plots global elevations
import os

import matplotlib.pyplot as plt
import rasterio

import mirage as mr
import mirage.vis as mrv
Let’s open the GeoTIFF file for the geoid heights
with rasterio.open(
    os.path.join(os.environ['DATADIR'], 'us_nga_egm96_15.tif'), 'r'
) as f:
    mr.tic()
    x = f.read().squeeze()  # Geoid heights in [m]
    mr.toc()
Elapsed time: 2.24e-02 seconds
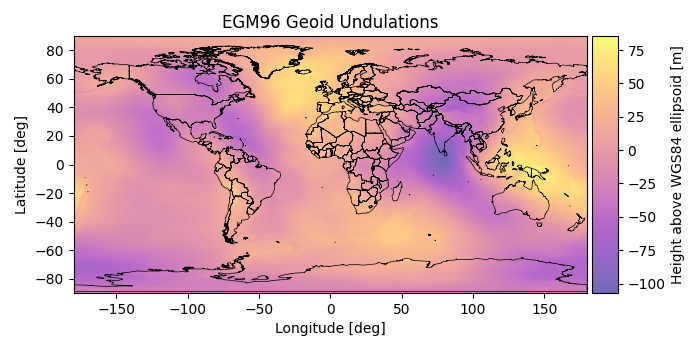
And plot with a map of the Earth below
mrv.plot_map_with_grid(
    x,
    'EGM96 Geoid Undulations',
    'Height above WGS84 ellipsoid [m]',
    alpha=0.6,
    cmap='plasma',
    borders=True,
)
plt.show()
Total running time of the script: (0 minutes 0.773 seconds)