Note
Go to the end to download the full example code.
Solar System#
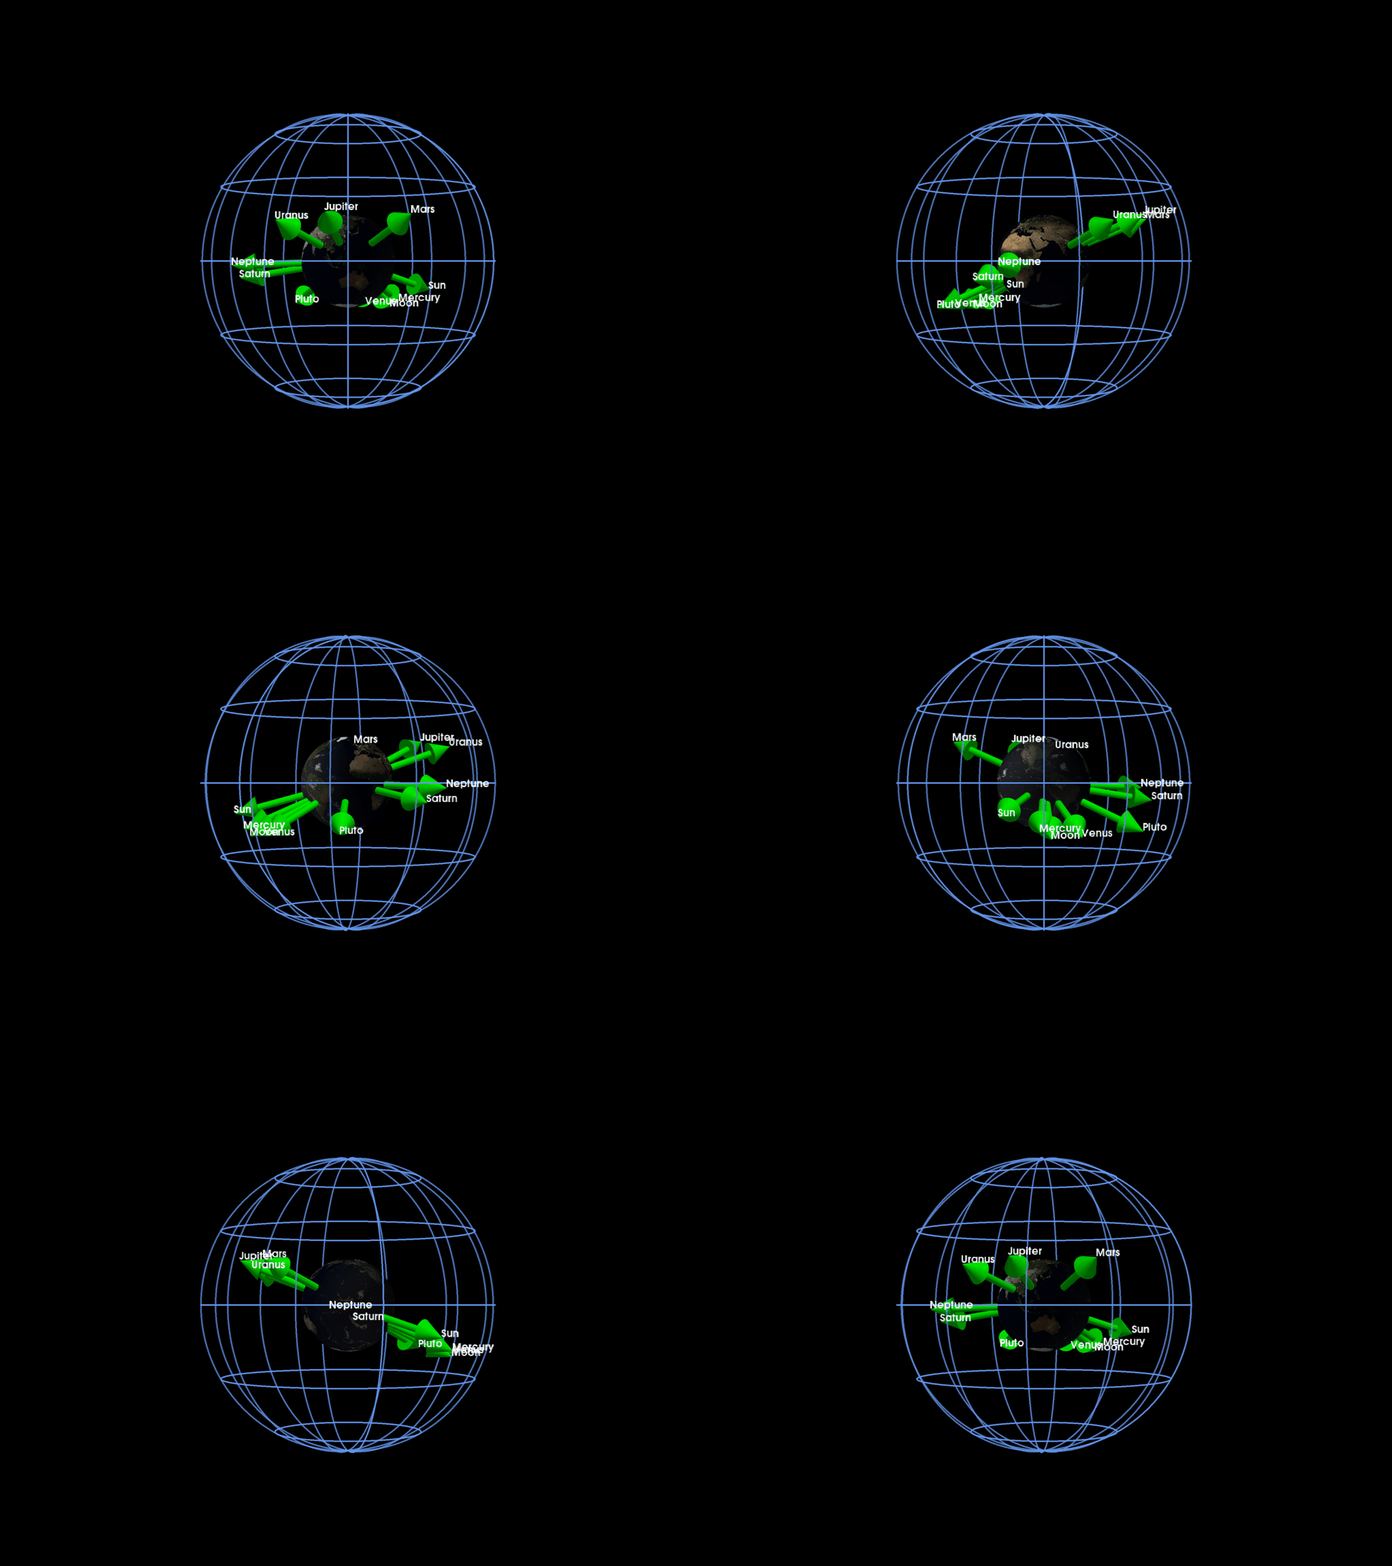
Plotting the solar system planet directions with respect to the Earth at a given time
import numpy as np
import pyvista as pv

import mirage as mr
import mirage.vis as mrv

date = mr.now()

fcns = np.array(
    [
        mr.mercury,
        mr.venus,
        mr.mars,
        mr.jupiter,
        mr.saturn,
        mr.uranus,
        mr.neptune,
        mr.moon,
        mr.sun,
        mr.pluto,
    ]
)

labels = np.array(
    [
        'Mercury',
        'Venus',
        'Mars',
        'Jupiter',
        'Saturn',
        'Uranus',
        'Neptune',
        'Moon',
        'Sun',
        'Pluto',
    ]
)

r = np.zeros((len(fcns), 3))
for i, fcn in enumerate(fcns):
    r[i, :] = fcn(date)

pl = pv.Plotter()
mrv.plot_earth(pl, date=date, lighting=False)

mag = 20000
planet_dirs = mr.hat(r)

for pi, labeli in zip(planet_dirs, labels):
    mrv.plot_arrow(
        pl,
        np.zeros(3),
        pi,
        color='lime',
        label=labeli,
        name=labeli,
        scale=mag * 0.8,
        font_size=15,
    )
grid = mrv.celestial_grid()
mrv.plot3(
    pl,
    mag * grid,
    color='cornflowerblue',
    line_width=5,
    lighting=False,
    opacity=0.2,
)

mrv.orbit_plotter(pl)

We can also plot the whole solar system by using SPICE interpolation
bodies = np.array(
    [
        'Mercury',
        'Venus',
        'Mars',
        'Jupiter',
        'Saturn',
        'Uranus',
    ]
)
periods = mr.days(
    np.array([87.97, 224.7, 686.98, 4332.589, 10759.22, 30688.5, 60182, 90560])
)

r_all = []
for body, period in zip(bodies, periods):
    print(body)
    dates, epsecs = mr.date_linspace(date, date + period, 100, return_epsecs=True)
    fine_dates, fine_epsecs = mr.date_linspace(
        dates[0], dates[-1], dates.size * 10, return_epsecs=True
    )
    r_all.append(mr.SpiceInterpolator(body, fine_dates)(fine_epsecs))
Mercury
Venus
Mars
Jupiter
Saturn
Uranus
Total running time of the script: (0 minutes 7.308 seconds)
