Note
Go to the end to download the full example code.
Calibrated Star Spectra#
Computing the apparent magnitude of a star from its absolute flux spectrum in a given passband
import os

import matplotlib.pyplot as plt
import numpy as np
from gaiaxpy import calibrate
from scipy.interpolate import interp1d

import mirage as mr
Let’s use GAIA’s calibrated spectra to compare with the CALSPEC spectra
mags = {
'V': 11.78,
'B': 11.46,
'R': 11.93098,
'I': 12.11202,
'G': 11.72116,
'G_BP': 11.54143,
'G_RP': 12.06725,
}
example_spec_path = os.path.join(os.environ['DATADIR'], 'stars', 'V2.SPSS001.ascii')
if not os.path.exists(example_spec_path):
mr.save_file_from_url(
'http://gaiaextra.ssdc.asi.it:8080/reduced/2/SPSSpublic/V2.SPSS001.ascii',
os.path.join(os.environ['DATADIR'], 'stars'),
)
lam_true, flux_true, flux_err_true = np.loadtxt(example_spec_path).T
star_id = 266077145295627520
lam_cal = np.linspace(350, 1020, 72)
spec = calibrate(
[star_id],
lam_cal,
username=os.environ['COSMOS_USERNAME'],
password=os.environ['COSMOS_PASSWORD'],
save_file=False,
)
flux_cal = spec[0]['flux'][0]
passband = mr.passband_by_name(lam_cal, 'G')
band_mag_from_cal_spec = mr.apparent_magnitude_in_band(lam_cal, flux_cal, 'G')
print(
f'Calibrated G magnitude: {band_mag_from_cal_spec:.2f}, catalog error {band_mag_from_cal_spec - mags["G"]:.3f}'
)
# Computing the mean error
flux_true_cal_lam = interp1d(lam_true, flux_true)(lam_cal)
percent_error = np.abs((flux_cal - flux_true_cal_lam) / flux_true_cal_lam * 100)
print(np.percentile(percent_error, [1, 50, 99]))
plt.figure(figsize=(4, 4))
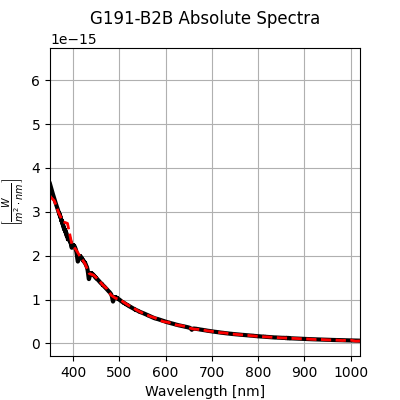
plt.title('G191-B2B Absolute Spectra')
plt.ylabel(r'$\left[ \frac{W}{m^2 \cdot nm} \right]$')
plt.xlabel('Wavelength [nm]')
plt.grid()
plt.plot(lam_true, flux_true, 'k', linewidth=3, label='CALSPEC')
plt.plot(lam_cal, flux_cal, 'r--', linewidth=2, label='GaiaXPy')
plt.xlim(lam_cal.min(), lam_cal.max())
plt.figure(figsize=(4, 4))
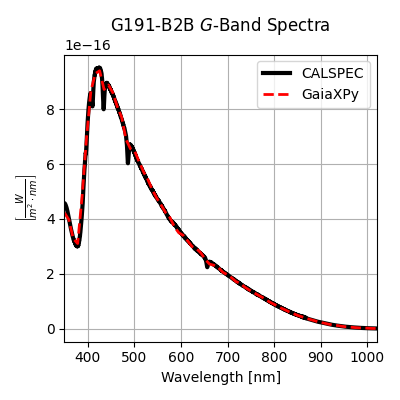
plt.title('G191-B2B $G$-Band Spectra')
plt.ylabel(r'$\left[ \frac{W}{m^2 \cdot nm} \right]$')
plt.xlabel('Wavelength [nm]')
plt.grid()
plt.plot(
lam_true,
flux_true * mr.passband_by_name(lam_true, 'G'),
'k',
linewidth=3,
label='CALSPEC',
)
plt.plot(
lam_cal,
flux_cal * mr.passband_by_name(lam_cal, 'G'),
'r--',
linewidth=2,
label='GaiaXPy',
)
plt.xlim(lam_cal.min(), lam_cal.max())
plt.legend()
plt.tight_layout()
plt.show()
INFO: Login to gaia TAP server [astroquery.gaia.core]
INFO: OK [astroquery.utils.tap.core]
INFO: Login to gaia data server [astroquery.gaia.core]
INFO: OK [astroquery.utils.tap.core]
Running query...
Running query... Done!
Reading input file...
Reading input file... Done!
Reading input file...
Reading input file... Done!

Calibrating data:   0%|          | 0/1 [00:00<?, ?spec/s]

Calibrated G magnitude: 11.65, catalog error -0.071
[ 0.03183508  1.20906473 14.38473528]
Using precise fluxes for a given reference star http://gaiaextra.ssdc.asi.it:8080/SPSSV2extendedfluxtable_user_show.php?sizelimit=150 And the Viziers info for this star to correlate IDs https://simbad.cds.unistra.fr/simbad/sim-id?Ident=G191-B2B&NbIdent=1&Radius=2&Radius.unit=arcmin&submit=submit+id
plt.figure(figsize=(4, 6))
for band_name, mag_true in mags.items():
passband = mr.passband_by_name(lam_true, band_name)
band_mag_from_true_spec = mr.apparent_magnitude_in_band(
lam_true, flux_true, band_name
)
print(
f'{band_name} magnitude: {band_mag_from_true_spec:.2f}, error {band_mag_from_true_spec - mag_true:.3f}'
)
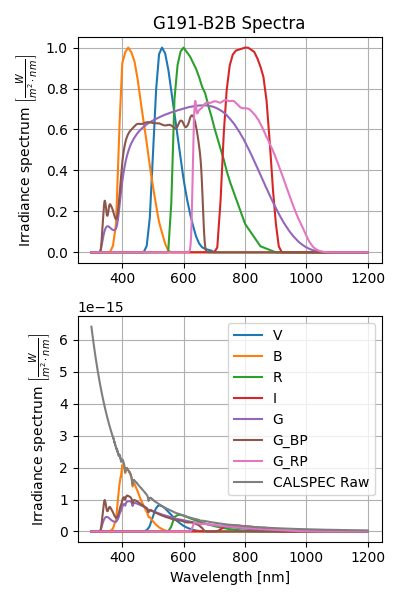
plt.subplot(2, 1, 1)
plt.plot(lam_true, passband, label=band_name)
plt.subplot(2, 1, 2)
plt.plot(lam_true, flux_true * passband, label=band_name)
u = r'$\left[ \frac{W}{m^2 \cdot nm} \right]$'
plt.subplot(2, 1, 1)
plt.title('G191-B2B Spectra')
plt.ylabel(f'Irradiance spectrum {u}')
plt.grid()
plt.subplot(2, 1, 2)
plt.grid()
plt.plot(lam_true, flux_true, label='CALSPEC Raw')
plt.xlabel('Wavelength [nm]')
plt.ylabel(f'Irradiance spectrum {u}')
plt.legend()
plt.tight_layout()
plt.show()
V magnitude: 11.76, error -0.016
B magnitude: 11.46, error 0.004
R magnitude: 11.90, error -0.031
I magnitude: 12.08, error -0.032
G magnitude: 11.64, error -0.085
G_BP magnitude: 11.47, error -0.071
G_RP magnitude: 12.03, error -0.037
Total running time of the script: (0 minutes 8.405 seconds)