Note
Go to the end to download the full example code.
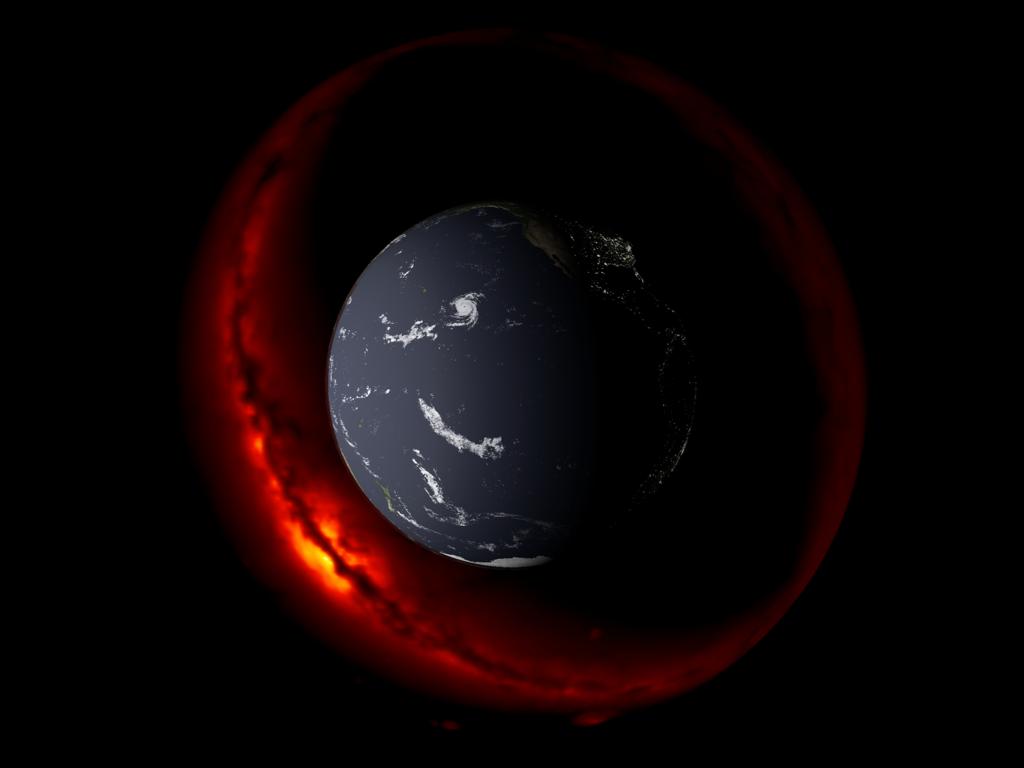
Background Signals at Zenith#
Plotting the general behavior of background signals for zodiac light, moonlight, and integrated starlight at zenith
import numpy as np
import pyvista as pv

import mirage as mr
import mirage.vis as mrv
Let’s choose a point after sunset on the US east coast
date = mr.utc(2023, 3, 1, 1)
integration_time_s = 1.0  # seconds
We can then generate the background signals for a set of spiral points
npts = int(1e6)
pts = 1e4 * mr.spiral_sample_sphere(npts)
sv = np.tile(mr.hat(mr.sun(date)), (npts, 1))
station = mr.Station(preset='pogs')
tdargs = (
    station,
    pts,
    pts / 2 + 0.01,
    integration_time_s,
)
ss = mr.integrated_starlight_signal(*tdargs)


def plot_sig(pl, s, cmap, scale=1):
    mrv.scatter3(
        pl,
        scale * pts,
        scalars=s,
        cmap=cmap,
        opacity=(s - np.min(s)) / (np.max(s) - np.min(s)),
        point_size=15,
        show_scalar_bar=False,
        lighting=False,
    )


pl = pv.Plotter()
(mrv.plot_earth(pl, mode='eci', date=date),)
plot_sig(pl, ss, 'fire', scale=1.2)
pl.camera.position = (35e3, 35e3, -8e3)

mrv.orbit_plotter(pl)
A still frame
pl = pv.Plotter()
(mrv.plot_earth(pl, mode='eci', date=date),)
plot_sig(pl, ss, 'fire', scale=1.2)
pl.camera.position = (35e3, 35e3, -8e3)
pl.show()
Total running time of the script: (0 minutes 14.183 seconds)