Note
Go to the end to download the full example code.
Synthetic RPO#
Generating and displaying synthetic images of a nearby space object
import json
import os

import matplotlib.pyplot as plt
import numpy as np
from PIL import Image

from mirage import synth as mrsyn
Generating the dataset with key point selection UI enabled
mrsyn.generate_synthetic_dataset(
    'matlib_goes17.obj',
    data_points=9,
    key_point_count=10,
    manual_key_point_selection=True,
    max_phase_deg=30,
)
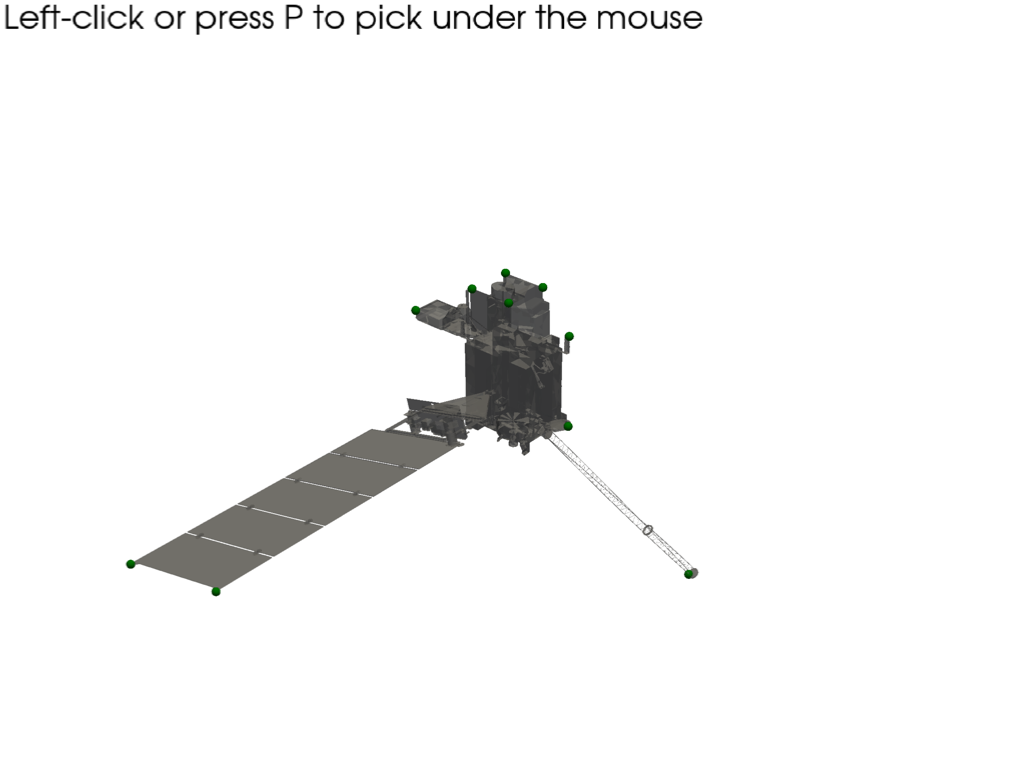
Found 11 key points!
Computed visibility for point 1/9, 0.14ish minutes remaining
Computed visibility for point 2/9, 0.03ish minutes remaining
Computed visibility for point 3/9, 0.03ish minutes remaining
Computed visibility for point 4/9, 0.02ish minutes remaining
Computed visibility for point 5/9, 0.02ish minutes remaining
Computed visibility for point 6/9, 0.01ish minutes remaining
Computed visibility for point 7/9, 0.01ish minutes remaining
Computed visibility for point 8/9, 0.00ish minutes remaining
Computed visibility for point 9/9, 0.00ish minutes remaining
Loading the resulting data
with open(os.path.join('out', 'iminfo.json'), 'r') as f:
    iminfo = json.load(f)
    kp_pix = np.array(iminfo['key_points']['image_pixels'])
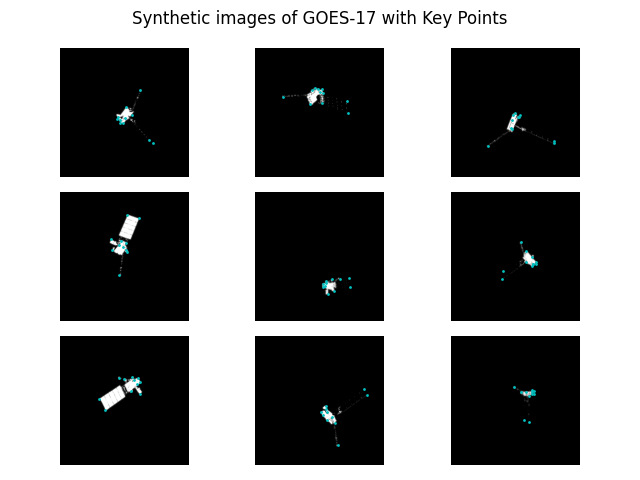
Plotting a grid of rendered images
fig, axs = plt.subplots(3, 3)
for fnum in range(9):
    plt.subplot(3, 3, fnum + 1)
    with Image.open(os.path.join('out', f'frame{fnum}.png'), 'r') as im:
        im_arr = np.array(im)
        plt.imshow(im_arr[:, :, 0], cmap='gray')
        plt.scatter(kp_pix[fnum, :, 0], kp_pix[fnum, :, 1], c='c', s=1)
        plt.axis('off')
fig.suptitle('Synthetic images of GOES-17 with Key Points', fontsize=12)
plt.tight_layout()
plt.show()
Total running time of the script: (0 minutes 4.341 seconds)