Note
Go to the end to download the full example code.
Background Signals#
The mean background signal model due to various sources
import datetime

import numpy as np
import pyvista as pv

import mirage as mr
import mirage.vis as mrv
Defining a function we can use to plot various background signals
def hemisphere_signal(
    station: mr.Station,
    date: datetime.datetime,
    signal_kwargs: dict,
) -> None:
    true_signals = [k for k in signal_kwargs.keys() if signal_kwargs[k]]
    if len(true_signals) == len(signal_kwargs.keys()):
        signal_type = 'All Signals'
    else:
        signal_type = true_signals[0].capitalize()

    pl = pv.Plotter()
    c_grid = mrv.celestial_grid(30, 30)
    c_grid = (station.eci_to_enu(date).T @ c_grid.T).T
    (g_az, g_el) = np.meshgrid(
        np.linspace(0, 2 * np.pi, 250, endpoint=False),
        np.linspace(np.deg2rad(0), np.pi / 2, 250, endpoint=False),
    )

    look_dirs_eci_eq = station.az_el_to_eci(g_az.flatten(), g_el.flatten(), date)
    dates = np.tile(date, (g_az.size, 1))
    stat_eci = station.j2000_at_dates(date)

    mr.tic()
    sb = station.sky_brightness(
        dates, look_dirs_eci_eq, **signal_kwargs, integration_time_s=1.0
    )
    mr.toc()
    mrv.plot_earth(
        pl,
        date=date,
        atmosphere=False,
        borders=True,
    )
    r_dome = 500  # km
    view_dist = 20e3  # km
    zoom = 4.5
    sargs = dict(
        height=0.75,
        vertical=True,
        position_x=0.05,
        position_y=0.05,
        title_font_size=24,
        label_font_size=20,
        shadow=True,
        n_labels=4,
        fmt='%.3e',
        font_family='courier',
        color='white',
    )

    mrv.plot3(
        pl,
        stat_eci + 1.03 * r_dome * c_grid,
        line_width=4,
        color='linen',
        lighting=False,
    )

    mrv.scatter3(
        pl,
        stat_eci + r_dome * look_dirs_eci_eq,
        scalars=sb.flatten(),
        cmap='bmy',
        point_size=10,
        lighting=False,
        clim=[0, np.max(sb)],
        scalar_bar_args=sargs,
    )
    pl.scalar_bar.SetTitle('[e-/pix]')
    pl.camera.focal_point = stat_eci.flatten()
    cpos = (stat_eci + mr.hat(stat_eci) * view_dist).flatten() - np.array([0, 0, 1e4])
    pl.camera.position = cpos
    pl.camera.zoom(zoom)

    pl.add_text(
        f'{signal_type}: {date.strftime("%m/%d/%Y, %H:%M:%S")} UTC',
        name='utc_str',
        font='courier',
        color='white',
    )

    pl.show()
Setting up observation conditions using an example Space Debris Telescope preset from Krag2003 station = mr.Station(preset=”lmt”, lat_deg=33.776864, lon_deg=-84.363777) # Atlanta, GA
station = mr.Station(preset='pogs')
date = mr.utc(2023, 10, 1, 5, 45, 0)  # Fig 5.38
Plotting the background signal for scattered moonlight
signal_kwargs = {
    'moonlight': True,
    'airglow': False,
    'integrated_starlight': False,
    'zodiac': False,
    'pollution': False,
    'twilight': False,
}
hemisphere_signal(station, date, signal_kwargs)
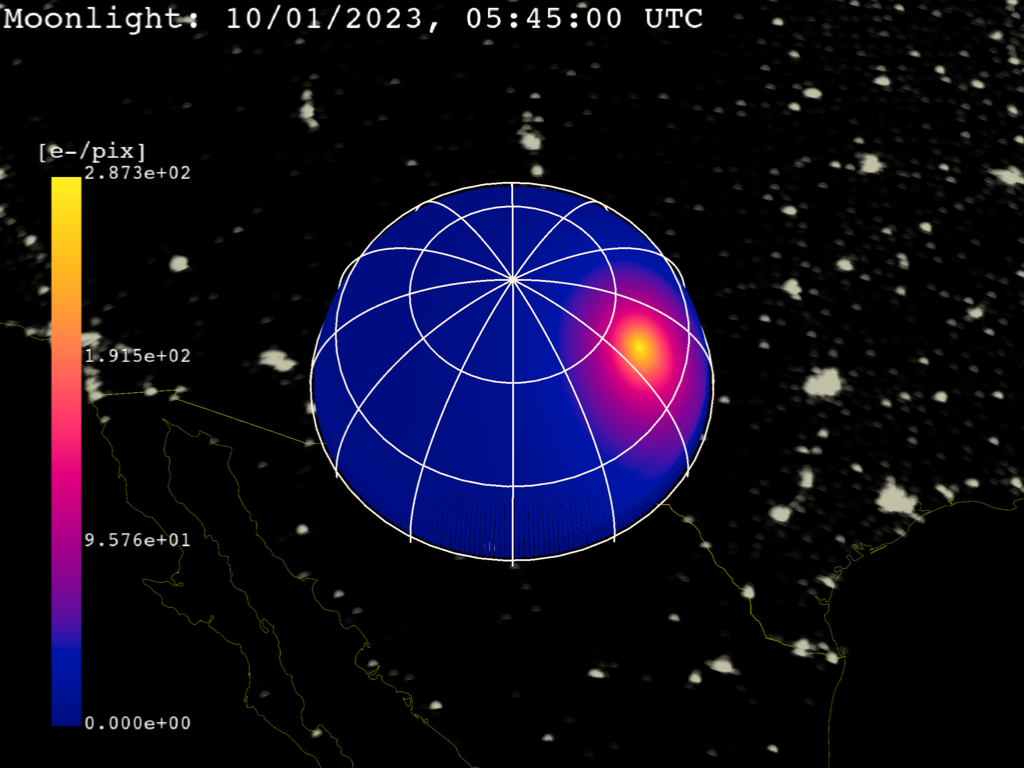
Elapsed time: 4.71e+00 seconds
Plotting the background signal for integrated starlight
signal_kwargs = {
    'moonlight': False,
    'airglow': False,
    'integrated_starlight': True,
    'zodiac': False,
    'pollution': False,
    'twilight': False,
}
hemisphere_signal(station, date, signal_kwargs)
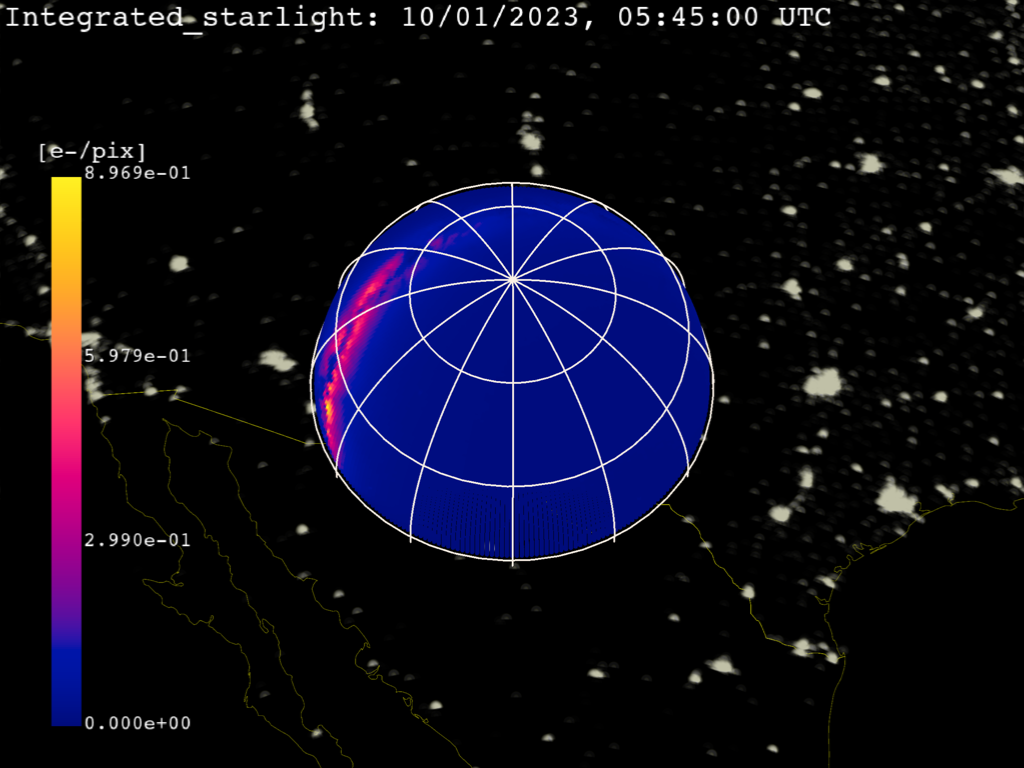
Elapsed time: 2.24e+00 seconds
Plotting the background signal for light pollution
signal_kwargs = {
    'moonlight': False,
    'airglow': False,
    'integrated_starlight': False,
    'zodiac': False,
    'pollution': True,
    'twilight': False,
}
hemisphere_signal(station, date, signal_kwargs)
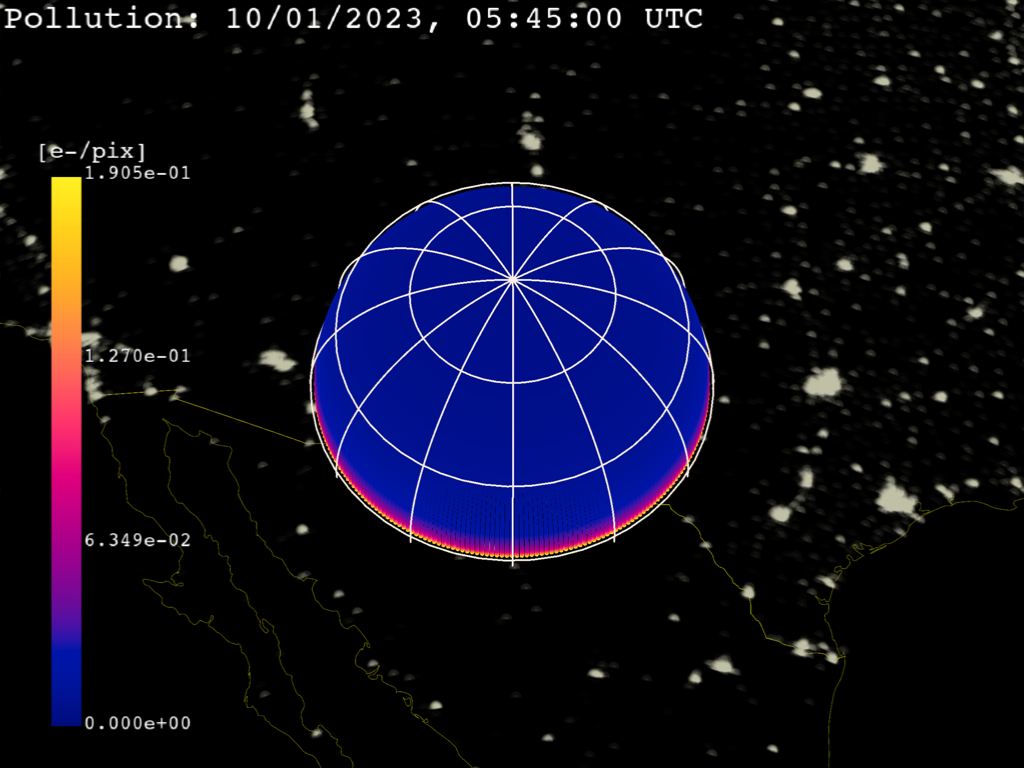
Elapsed time: 2.09e+00 seconds
Plotting the background signal for zodiac light
signal_kwargs = {
    'moonlight': False,
    'airglow': False,
    'integrated_starlight': False,
    'zodiac': True,
    'pollution': False,
    'twilight': False,
}
hemisphere_signal(station, date, signal_kwargs)
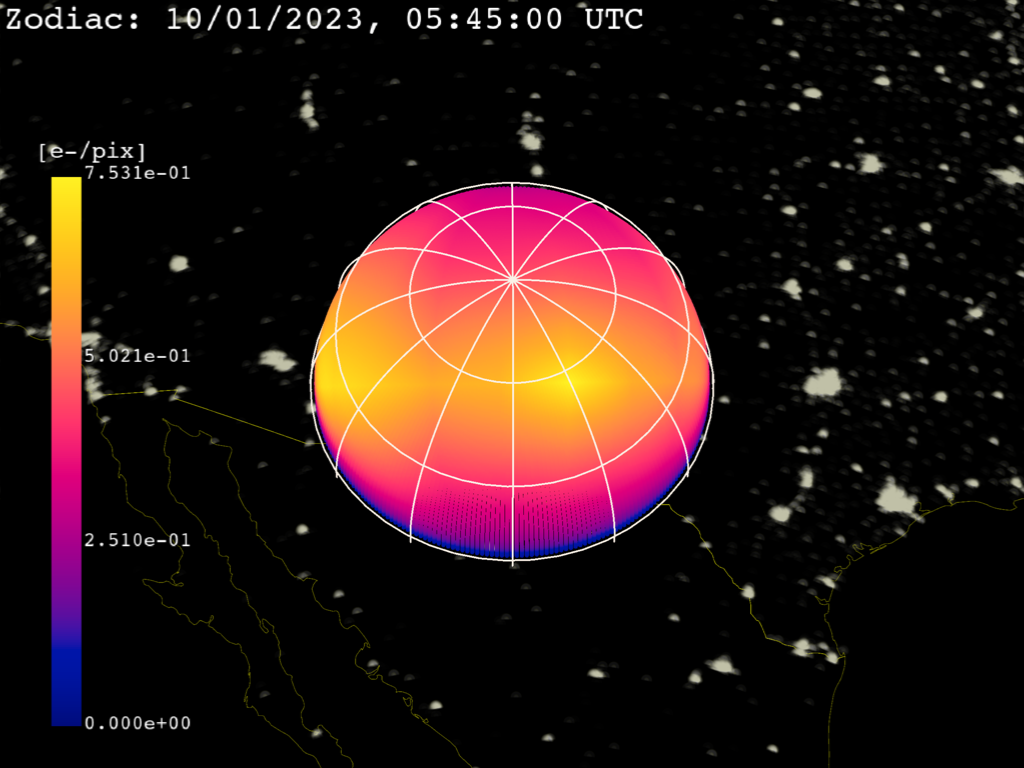
Elapsed time: 3.19e+00 seconds
Plotting the background signal for airglow
signal_kwargs = {
    'moonlight': False,
    'airglow': True,
    'integrated_starlight': False,
    'zodiac': False,
    'pollution': False,
    'twilight': False,
}
hemisphere_signal(station, date, signal_kwargs)
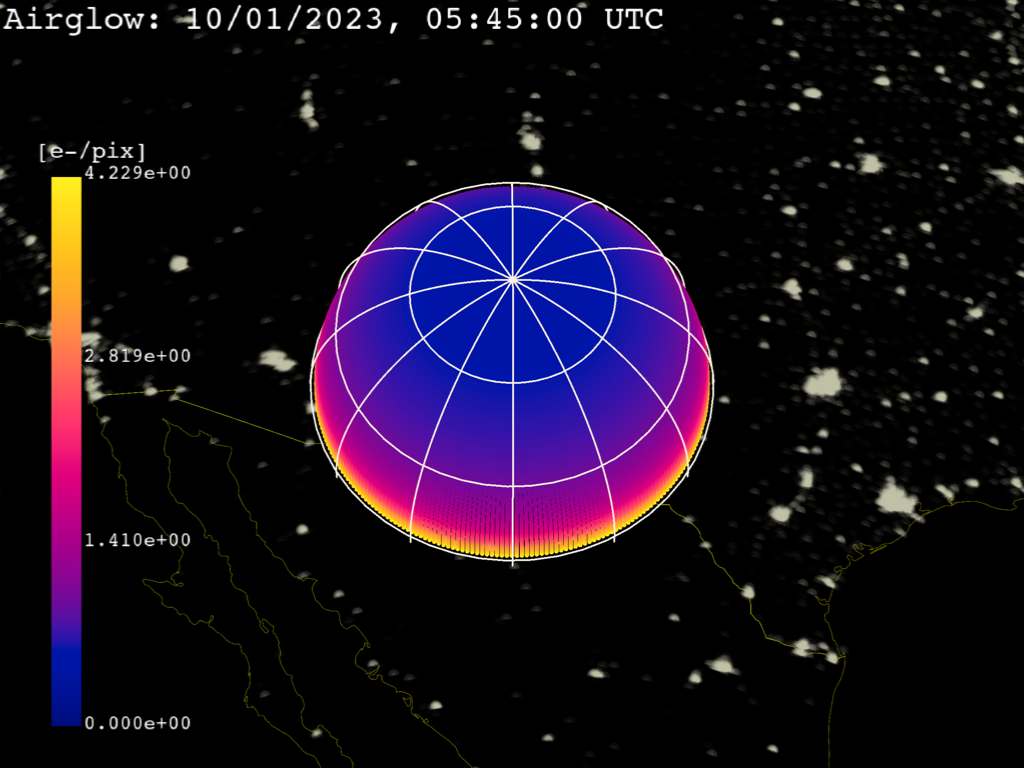
Elapsed time: 2.36e+00 seconds
Plotting the background signal for scattered twilight
signal_kwargs = {
    'moonlight': False,
    'airglow': False,
    'integrated_starlight': False,
    'zodiac': False,
    'pollution': False,
    'twilight': True,
}
hemisphere_signal(station, date - mr.hours(4), signal_kwargs)

Elapsed time: 7.33e+00 seconds
Plotting the full background signal with all sources enabled
signal_kwargs = {
    'moonlight': True,
    'airglow': True,
    'integrated_starlight': True,
    'zodiac': True,
    'pollution': True,
    'twilight': True,
}
hemisphere_signal(station, date, signal_kwargs)
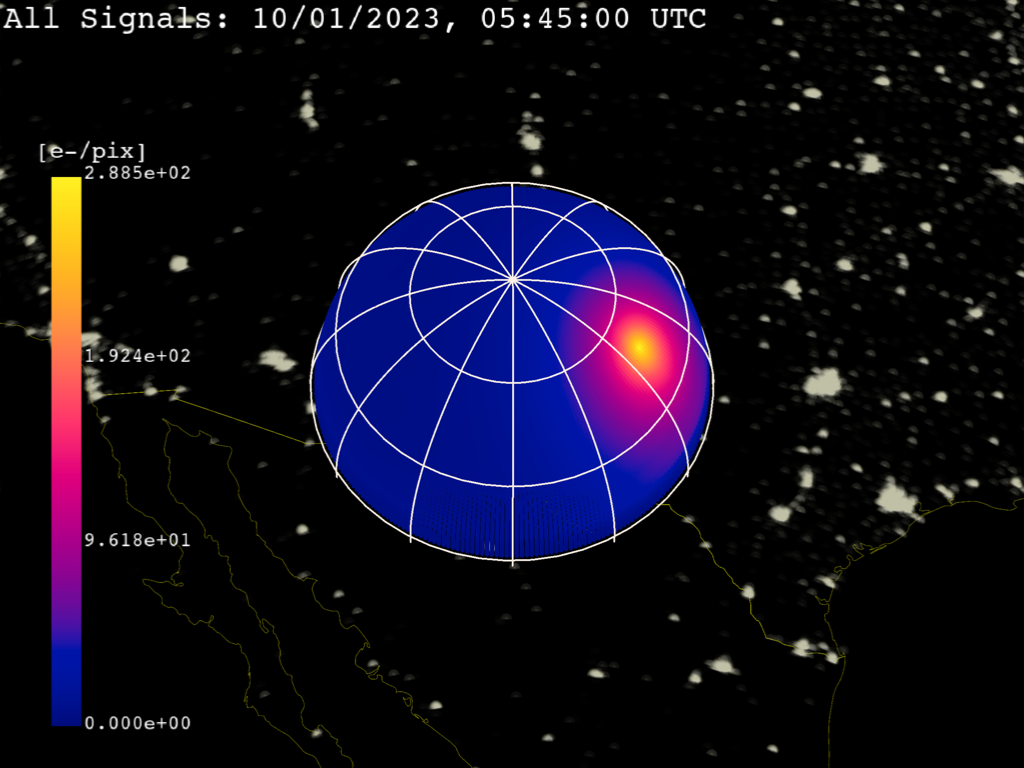
Elapsed time: 1.15e+01 seconds
Total running time of the script: (0 minutes 42.449 seconds)