Note
Go to the end to download the full example code.
Background Importance#
Plotting the changes in background signal values over the course of one night
import datetime

import matplotlib.pyplot as plt
import numpy as np

import mirage as mr
Defining a function we can use to plot various background signals
res = 40

lons = np.linspace(0, 2 * np.pi, res, endpoint=False)
lats = np.linspace(np.deg2rad(15), np.pi / 2, res, endpoint=False)
dlon = lons[1] - lons[0]
dlat = lats[1] - lats[0]
(g_az, g_el) = np.meshgrid(
    lons,
    lats,
)

lon_lims = (g_az, g_az + dlon)
lat_lims = (g_el, g_el + dlat)

areas = mr.lat_lon_cell_area(lon_lims_rad=lon_lims, lat_lims_rad=lat_lims, radius=1)
area_int = areas.sum()  # total area in steradians that we're integrating over


def hemisphere_signal(
    station: mr.Station,
    dates: datetime.datetime,
    integration_time_s: float,
    signal_kwargs: dict,
) -> None:
    true_signals = [k for k in signal_kwargs.keys() if signal_kwargs[k]]
    if len(true_signals) == len(signal_kwargs.keys()):
        signal_type = 'All Signals'
    else:
        signal_type = true_signals[0].capitalize()

    lde = []
    for date in dates:
        look_dirs = station.az_el_to_eci(g_az.flatten(), g_el.flatten(), date)
        lde.append(look_dirs)

    look_dirs_eci_eq_tiled = np.vstack(lde)
    dates_tiled = np.repeat(dates, g_az.size)  # az, el, time

    mr.tic(signal_type)
    sb = station.sky_brightness(
        dates_tiled, look_dirs_eci_eq_tiled, integration_time_s, **signal_kwargs
    )
    mr.toc()

    print(f'Max:  {sb.max():.2e}')
    print(f'Mean: {sb.mean():.2e}')
    return sb
Setting up observation conditions using an example Space Debris Telescope preset from Krag2003 station = mr.Station(preset=”lmt”, lat_deg=33.776864, lon_deg=-84.363777) # Atlanta, GA
station = mr.Station(preset='pogs')
integration_time_s = 1.0
date = mr.utc(2023, 10, 1, 0, 0, 0)
Plotting the background signal for scattered moonlight
signals = [
    'moonlight',
    'airglow',
    'integrated_starlight',
    'zodiac',
    'pollution',
    'twilight',
]
cs = ['k', 'm', 'c', 'b', 'r', 'g']

dates = mr.date_arange(date, date + mr.hours(14), mr.hours(0.5))
sun_ang_deg = np.rad2deg(mr.sun_angle_to_horizon(dates, station.itrf)).flatten()
is_astro_dark = sun_ang_deg < -18.0
is_nautical_dark = ~is_astro_dark & (sun_ang_deg < -12.0)
is_civil_dark = ~is_astro_dark & ~is_nautical_dark & (sun_ang_deg < -6.0)
is_light_dates = sun_ang_deg > 0.0

dates = dates[~is_light_dates]
hr_after_dark = mr.date_to_epsec(dates) / 3600

sbs = []

p1 = plt.figure(figsize=(4, 4))
p2 = plt.figure(figsize=(4, 4))

for signal, c in zip(signals, cs):
    kwargs = {s: (False if s is not signal else True) for s in signals}
    sb = hemisphere_signal(station, dates, integration_time_s, kwargs)
    sb = sb.reshape(dates.size, -1)
    sbs.append(sb)

    label = signal.replace('_', ' ').capitalize()
    if len(label.split(' ')) > 1:
        label = label.split(' ')[1].capitalize()

    plt.figure(1)
    plt.plot(hr_after_dark, np.max(sb, axis=1), c=c, marker='+', label=label)
    plt.xlabel('Hours after sunset')
    plt.ylabel('Signal rate maximum [ADU / pix / s]')
    plt.yscale('log')
    plt.grid(visible=True)
    plt.tight_layout()

    plt.figure(2)
    plt.plot(hr_after_dark, np.mean(sb, axis=1), c=c, marker='+', label=label)
    plt.xlabel('Hours after sunset')
    plt.ylabel('Signal rate mean [ADU / pix / s]')
    plt.yscale('log')
    plt.grid(visible=True)

plt.legend(loc='upper center', ncol=2, fancybox=True, shadow=True)

plt.tight_layout()
plt.show()
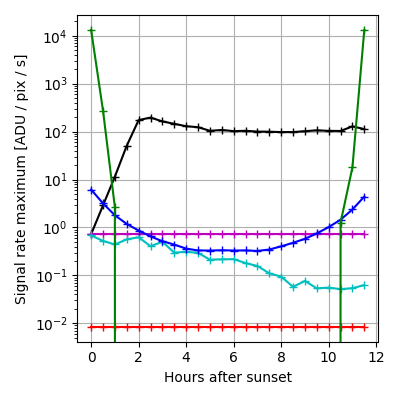
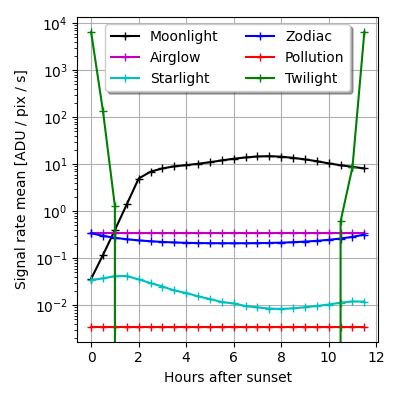
Moonlight: 2.45e+00 seconds
Max:  1.96e+02
Mean: 9.13e+00
Airglow: 1.25e+00 seconds
Max:  7.28e-01
Mean: 3.42e-01
Integrated_starlight: 1.26e+00 seconds
Max:  6.80e-01
Mean: 1.85e-02
Zodiac: 1.75e+00 seconds
Max:  6.18e+00
Mean: 2.40e-01
Pollution: 1.12e+00 seconds
Max:  8.42e-03
Mean: 3.45e-03
Twilight: 4.02e+00 seconds
Max:  1.33e+04
Mean: 5.44e+02
Figuring out how likely a given look direction over the night will be dominated by a given source
sbs = np.dstack(sbs)
mc = np.argmax(sbs, axis=-1)

areas = np.tile(areas.reshape(1, -1), (len(dates), 1))


for i, signal in enumerate(signals):
    p = (
        areas[mc == i].sum() / area_int / len(dates) * 100
    )  # percent of area-time covered
    print(signal, p)
moonlight 80.22320892102245
airglow 0.0
integrated_starlight 0.0060638560973488
zodiac 0.3490721663038389
pollution 0.0
twilight 19.42165505657638
Total running time of the script: (0 minutes 13.081 seconds)