Note
Go to the end to download the full example code.
Simple Box-Wing Light Curves#
3.2589705210411477 28.972879729243168
import matplotlib.pyplot as plt
import numpy as np
import mirage as mr
station = mr.Station()
obj = mr.SpaceObject('matlib_goes17.obj', identifier='GOES 17')
a_pan = 3.0 * 1.27 # m^2
a_bus = 0.8 * 1.1 # m^2
d0 = mr.utc(2024, 10, 18)
dates, epsecs = mr.date_linspace(d0, d0 + mr.hours(14), 100, return_epsecs=True)
r_obj = obj.propagate(dates)
svi = mr.sun(dates) - r_obj # from obj to sun
ovi = station.j2000_at_dates(dates) - r_obj # from obj to obs
z_obs = mr.angle_between_vecs(station.j2000_at_dates(dates), -ovi)
f = (
mr.AstroConstants.sun_irradiance_vacuum
/ (mr.vecnorm(ovi) ** 2 * 1e6)
/ (mr.vecnorm(svi) / mr.AstroConstants.au_to_km) ** 2
)
f = f.flatten()
lambdas = np.linspace(300, 1000, 100)
spec = mr.scaled_solar_spectrum(1, lambdas=lambdas)
atmos_trans = mr.atmospheric_transmission(lambdas, z_obs, station.alt_km)
gmag_f = lambda exo_irrad: mr.apparent_magnitude_in_band(
lambdas, exo_irrad.reshape(-1, 1) * (spec * atmos_trans), band='G'
)
attitude = mr.AlignedAndConstrainedAttitude(
mr.hat(r_obj), mr.hat(svi), dates, axis_order=(2, 0, 1)
)
q_of_t, w_of_t = attitude.propagate(epsecs)
d_of_t = mr.quat_to_dcm(q_of_t) # inertial to body
svb = mr.stack_mat_mult_vec(d_of_t, svi)
ovb = mr.stack_mat_mult_vec(d_of_t, ovi)
s = mr.hat(svi)
o = mr.hat(ovi)
h = mr.hat(s + o)
n_bus = -mr.hat(r_obj)
brdf = mr.Brdf('cook-torrance', cd=0.5, cs=0.5, n=0.5)
fr_pan = brdf.eval_normalized_brightness(s, o, s)
fr_bus = brdf.eval_normalized_brightness(s, o, n_bus)
lc_simp = (a_bus * fr_bus + a_pan * fr_pan).flatten()
lc_fancy = mr.run_light_curve_engine(
brdf,
obj,
mr.hat(svb),
mr.hat(ovb),
show_window=True,
verbose=False,
rotate_panels=True,
frame_rate=100,
instances=1,
)
percent_err_at_peak = np.abs(lc_simp.max() - lc_fancy.max()) / lc_fancy.max() * 100
median_err = np.mean(np.abs(lc_simp - lc_fancy) / lc_fancy) * 100
print(percent_err_at_peak, median_err)
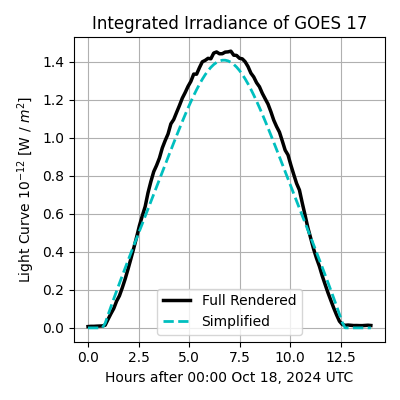
plt.figure(figsize=(4, 4))
plt.plot(epsecs / 3600, lc_fancy * f * 1e12, 'k', linewidth=2.5, label='Full Rendered')
plt.plot(epsecs / 3600, lc_simp * f * 1e12, 'c--', linewidth=2, label='Simplified')
plt.grid()
plt.legend()
plt.title('Integrated Irradiance of GOES 17')
plt.xlabel('Hours after 00:00 Oct 18, 2024 UTC')
plt.ylabel('Light Curve $10^{-12}$ [W / $m^2$]')
plt.tight_layout()
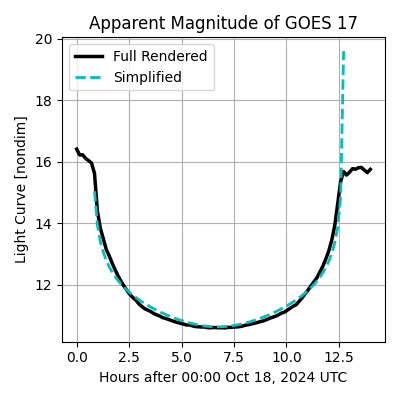
plt.figure(figsize=(4, 4))
plt.plot(
epsecs / 3600,
gmag_f(lc_fancy * f),
'k',
linewidth=2.5,
label='Full Rendered',
)
plt.plot(
epsecs / 3600,
gmag_f(lc_simp * f),
'c--',
linewidth=2,
label='Simplified',
)
plt.gca().invert_yaxis()
plt.grid()
plt.legend()
plt.title('G-Band Apparent Magnitude of GOES 17')
plt.xlabel('Hours after 00:00 Oct 18, 2024 UTC')
plt.ylabel('Light Curve [nondim]')
plt.tight_layout()
plt.show()
Total running time of the script: (0 minutes 2.559 seconds)