Note
Go to the end to download the full example code.
Airy Disk Gaussian Fit#
Comparing the Airy disk diffraction pattern to its Gaussian approximation
import matplotlib.pyplot as plt
import numpy as np

import mirage as mr
import mirage.vis as mrv

telescope = mr.Telescope(preset='pogs')
telescope.sensor_pixels = np.array([400, 300])
telescope.pixel_scale = 0.005
telescope.fwhm = (
    telescope.airy_disk_fwhm(550) * mr.AstroConstants.rad_to_arcsecond
)  # arcseconds
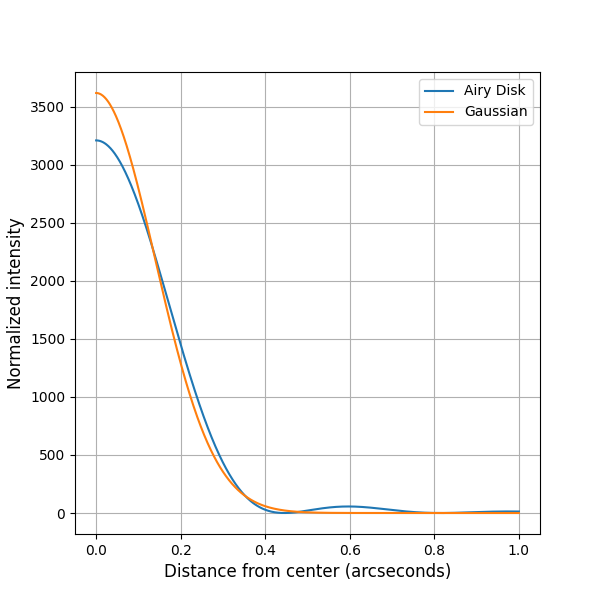
One dimensional falloff as a function of the distance from the center of the image
c_all = 1000
r_pix = np.linspace(0, telescope.sensor_pixels[0] // 2, int(1e3))
theta_arcsec = r_pix * telescope.pixel_scale
theta_rad = mr.dms_to_rad(0, 0, theta_arcsec)
airy_pattern = telescope.airy_disk_pattern(c_all, theta_rad, 550)
gaussian_pattern = telescope.gaussian_diffraction_pattern(c_all, theta_rad)

plt.figure(figsize=(6, 6))
plt.plot(theta_arcsec, airy_pattern, label='Airy Disk')
plt.plot(theta_arcsec, gaussian_pattern, label='Gaussian')
mrv.texit('', 'Distance from center (arcseconds)', 'Normalized intensity')
plt.legend()
plt.show()
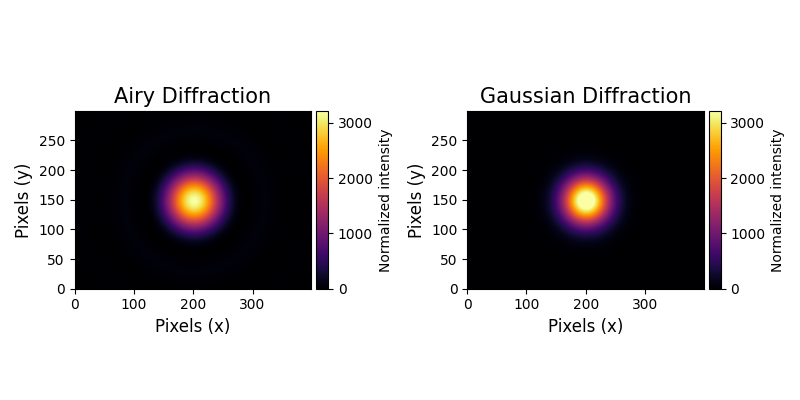
Two dimensional renders
obj_pos = (
    telescope.sensor_pixels[0] // 2 + np.random.rand(),
    telescope.sensor_pixels[1] // 2 + np.random.rand(),
)
x_pix, y_pix = np.meshgrid(
    np.arange(telescope.sensor_pixels[0]), np.arange(telescope.sensor_pixels[1])
)
r_dist = np.sqrt((x_pix - obj_pos[0]) ** 2 + (y_pix - obj_pos[1]) ** 2)
theta_grid_rad = mr.dms_to_rad(0, 0, r_dist * telescope.pixel_scale)

mr.tic()
airy_pattern = telescope.airy_disk_pattern(c_all, theta_grid_rad, 550)
mr.toc()
mr.tic()
gaussian_pattern = telescope.gaussian_diffraction_pattern(c_all, theta_grid_rad)
mr.toc()
Elapsed time: 2.44e-03 seconds
Elapsed time: 5.64e-04 seconds
Let’s look at the volume of both distributions
print(f'Airy disk volume: {np.sum(airy_pattern):.4f}')
print(f'Gaussian volume: {np.sum(gaussian_pattern):.4f}')
Airy disk volume: 20080782.8129
Gaussian volume: 17640682.1520
Visualize the Airy disk on the CCD grid
plt.figure(figsize=(8, 4))
plt.subplot(1, 2, 1)
plt.imshow(
    airy_pattern,
    cmap='inferno',
    extent=[x_pix.min(), x_pix.max(), y_pix.min(), y_pix.max()],
)
mrv.texit('Airy Diffraction', 'Pixels (x)', 'Pixels (y)', grid=False)
plt.colorbar(label='Normalized intensity', cax=mrv.get_cbar_ax())
plt.clim(0, np.max(airy_pattern))
plt.subplot(1, 2, 2)
plt.imshow(
    gaussian_pattern,
    cmap='inferno',
    extent=[x_pix.min(), x_pix.max(), y_pix.min(), y_pix.max()],
)
mrv.texit('Gaussian Diffraction', 'Pixels (x)', 'Pixels (y)', grid=False)
plt.colorbar(label='Normalized intensity', cax=mrv.get_cbar_ax())
plt.clim(0, np.max(airy_pattern))
plt.tight_layout()
plt.show()
Total running time of the script: (0 minutes 0.418 seconds)