Note
Go to the end to download the full example code.
Live Satellites From Observer#
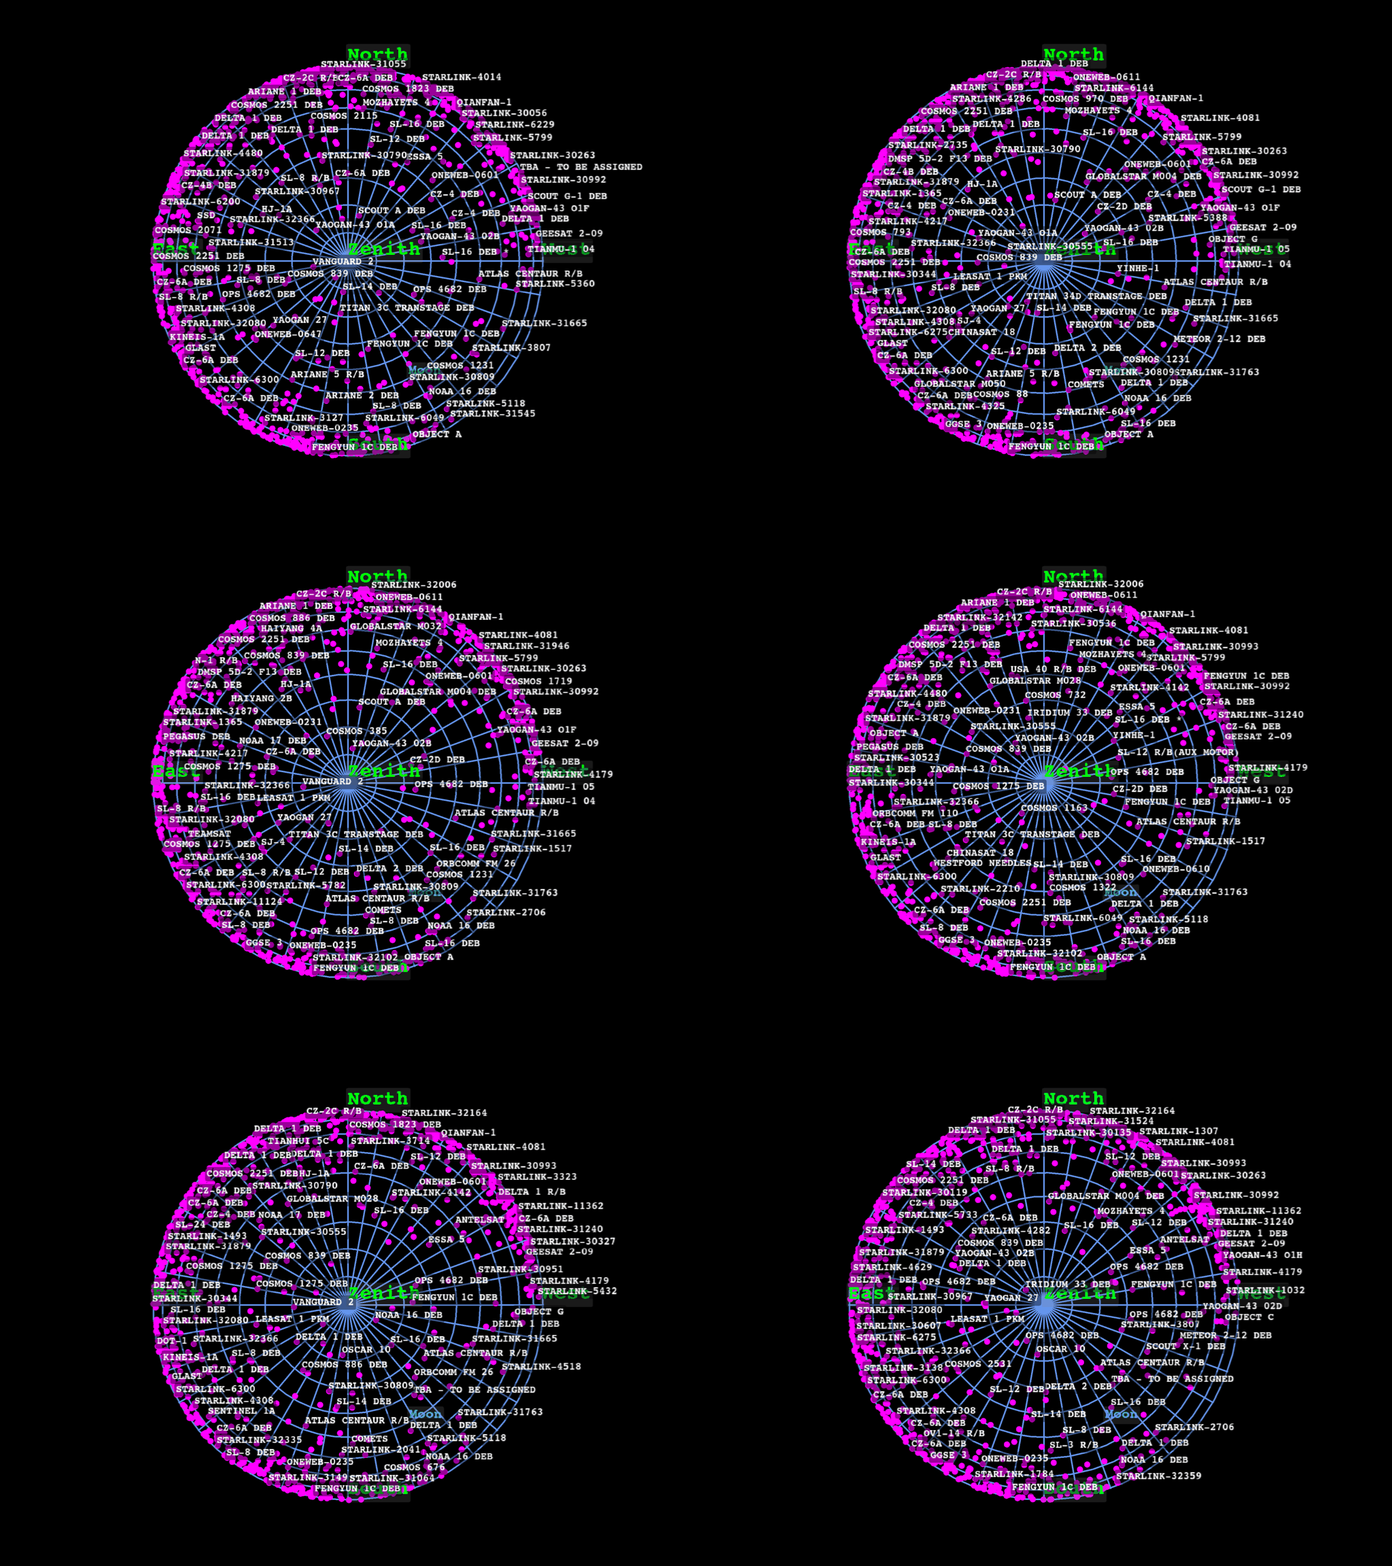
Plots satellites that would be visible from a station’s telescope in real time
import numpy as np
import pyvista as pv
from alive_progress import alive_bar

import mirage as mr
import mirage.vis as mrv


def lat_lon_of_address(identifier: str) -> tuple[float, float]:
    """Finds the (geodetic) latitude and longitude for a given address string

    :param identifier: Address string, ex: "Vandalia, Illinois"
    :type identifier: str
    :return: Geodetic latitude and longitude, both in [deg]
    :rtype: tuple[float, float]
    """
    import geopy

    loc = geopy.geocoders.Nominatim(user_agent='GetLoc').geocode(identifier)
    return loc.latitude, loc.longitude
Since I’m currently stuck in the Philadelphia airport, let’s plot things from the perspective of there obs_lat, obs_lon = lat_lon_of_address(“Philadelphia, PA”)
station = mr.Station()
Let’s impose a signal to noise ratio constraint, require satellites to be above the horizon, be illuminated, and have a visual magnitude brighter than 12
station.constraints = [
    mr.SnrConstraint(5),
    mr.ElevationConstraint(0),
    mr.TargetIlluminatedConstraint(),
    mr.VisualMagnitudeConstraint(12),
]
We can now plot everything!
pl = pv.Plotter()
pl.set_background('k')

pl.add_point_labels(
    np.vstack((np.eye(3), -np.eye(3)[:2, :])),
    ['East', 'North', 'Zenith', 'West', 'South'],
    text_color='lime',
    font_family='courier',
    font_size=30,
    shape_opacity=0.2,
    always_visible=True,
    show_points=False,
    name='enu_labels',
)

# Plotting the Azimuth/Elevation sphere
lines, labels, label_pos = mrv.celestial_grid(10, 10, return_labels=True)
mrv.plot3(
    pl,
    lines,
    lighting=False,
    color='cornflowerblue',
    line_width=5,
    name='local_grid',
    opacity=lines[:, 2] >= 0,
)


def show_scene(epsec: float, integration_time_s: float):
    date = mr.today() + mr.seconds(epsec)  # Fig 5.38
    r_eci, v_eci, names = mr.propagate_catalog_to_dates(date, return_names=True)
    station_eci = station.j2000_at_dates(date)
    look_vec_eci = r_eci - station_eci
    look_dir_eci = mr.hat(look_vec_eci)
    r_enu = (station.eci_to_enu(date) @ look_dir_eci.T).T

    r_moon_eci = mr.moon(date)
    r_station_to_moon_eci = r_moon_eci - station_eci
    r_moon_enu = (station.eci_to_enu(date) @ mr.hat(r_station_to_moon_eci).T).T
    r_sun_eci = mr.sun(date)

    obs_to_obj_rmag = mr.vecnorm(look_vec_eci)
    obj_to_sun_eci = r_sun_eci - r_eci
    phase_angle_rad = mr.angle_between_vecs(obj_to_sun_eci, -look_vec_eci)

    lc_sphere = (
        mr.normalized_light_curve_sphere(1, 1, phase_angle_rad)
        / (1e3 * obs_to_obj_rmag) ** 2
        * mr.AstroConstants.sun_irradiance_vacuum
    )

    constraint_satisfaction = station.eval_constraints(
        obs_pos_eci=station_eci,
        look_dir_eci=look_dir_eci,
        target_pos_eci=r_eci,
        dates=date,
        lc=lc_sphere,
        evaluate_all=False,
        integration_time_s=integration_time_s,
    )

    mrv.scatter3(
        pl,
        r_enu,
        point_size=20,
        lighting=False,
        color='m',
        name='sat_enu',
        opacity=constraint_satisfaction,
        render=False,
    )

    pl.add_point_labels(
        r_moon_enu,
        ['Moon'],
        text_color='cyan',
        font_family='courier',
        font_size=20,
        shape_opacity=0.2,
        always_visible=True,
        show_points=True,
        name='moon_label',
        render=False,
    )

    # pl.add_point_labels(
    #     r_sun_enu,
    #     ["Sun"],
    #     text_color="yellow",
    #     font_family="courier",
    #     font_size=20,
    #     shape_opacity=0.2,
    #     always_visible=True,
    #     show_points=True,
    #     name="sun_label",
    #     render=False
    # )

    pl.add_point_labels(
        r_enu[constraint_satisfaction, :],
        names[constraint_satisfaction],
        text_color='white',
        font_family='courier',
        shape_color='k',
        font_size=15,
        shape_opacity=0.4,
        always_visible=True,
        show_points=False,
        name='obj_labels',
        render=False,
    )

    pl.add_text(
        f'{date.strftime("%m/%d/%Y, %H:%M:%S")} UTC',
        name='utc_str',
        font='courier',
    )

    pl.set_viewup((0.0, 1.0, 0.0), render=False)
    pl.set_focus((0.0, 0.0, 0.5), render=False)
    pl.set_position((0.0, 0.0, -5.0))


pl.open_gif('test.gif')
frames = 60
with alive_bar(frames) as bar:
    for i in np.linspace(0, 80, frames):
        show_scene(i, integration_time_s=10.0)
        pl.write_frame()
        bar()

pl.close()

|████████████████████████████████████████| 60/60 [100%] in 55.7s (1.08/s)
Total running time of the script: (1 minutes 1.071 seconds)
