Note
Go to the end to download the full example code.
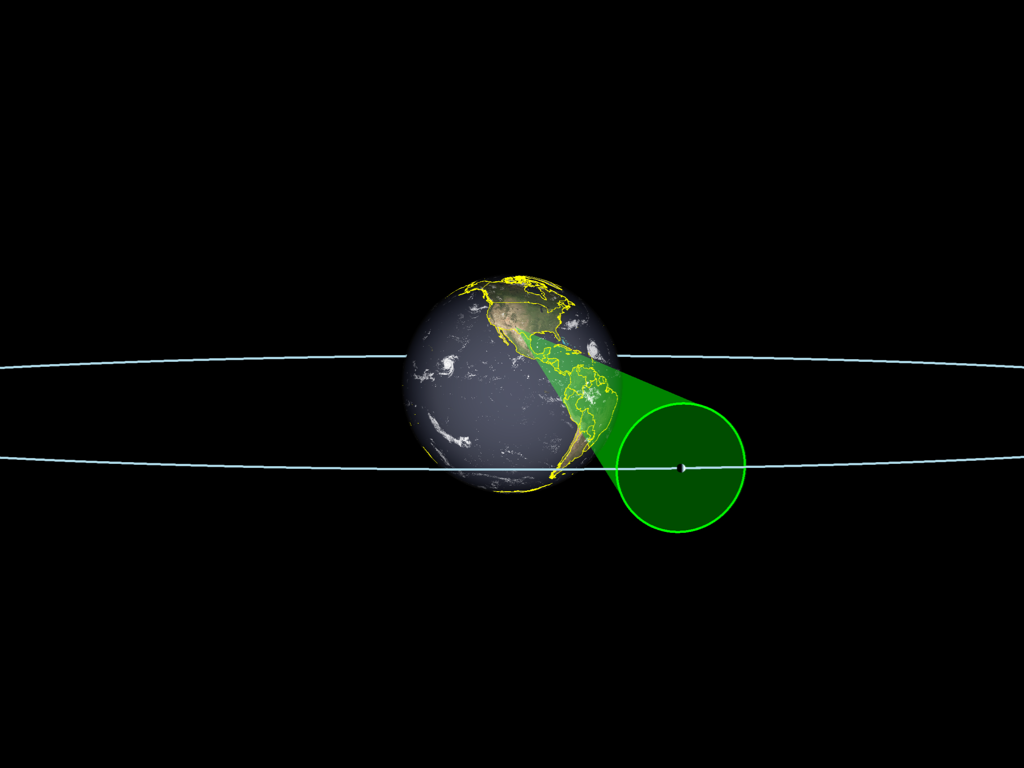
Conic Sensors#
Plotting conic sensors cones in 3D space
import numpy as np
import pyvista as pv

import mirage as mr
import mirage.vis as mrv

date = mr.utc(2023, 9, 22, 19)
dates = mr.date_linspace(date, date + mr.days(1), int(1e3))
station = mr.Station()
obj = mr.SpaceObject('cube.obj', identifier=44333)
r_sat = obj.propagate(dates)
r_to_sat = r_sat[0, :] - station.j2000_at_dates(date)
look_dir_eci = mr.hat(r_to_sat)

pl = pv.Plotter()
mrv.plot_conic_sensor(
    pl,
    station,
    date,
    look_dir_eci,
    half_angle_deg=3,
    extent=mr.vecnorm(r_to_sat),
    show_edges=True,
    color='lime',
)
mrv.plot_earth(pl, date=date, borders=True)
mrv.scatter3(pl, r_sat[0, :], point_size=20)
mrv.plot3(pl, r_sat, line_width=5, lighting=False)
pl.camera.position = 2 * r_sat[0, :] + np.array([0.0, 10e3, 5e3])
pl.show()
Total running time of the script: (0 minutes 1.894 seconds)