Note
Go to the end to download the full example code.
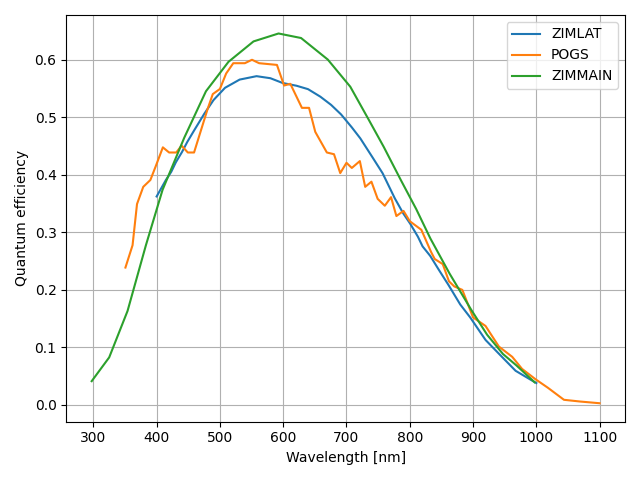
Quantum Efficiency Curves#
Comparing the quantum efficiencies for POGS and ZIMLAT
import os

import matplotlib.pyplot as plt
import polars as pl

import mirage as mr  # noqa

df_zimlat = pl.read_csv(os.path.join(os.environ['DATADIR'], 'zimlat_qe.csv'))
df_pogs = pl.read_csv(
    os.path.join(os.environ['DATADIR'], 'kaf16803_quantum_efficiency.csv')
)
df_zimmain = pl.read_csv(os.path.join(os.environ['DATADIR'], 'qe_zl55cmos.csv'))

plt.plot(df_zimlat['lambda_nm'], df_zimlat['qe'], label='ZIMLAT')
plt.plot(df_pogs['lambda_nm'], df_pogs['qe'], label='POGS')
plt.plot(df_zimmain['lambda_nm'], df_zimmain['qe'], label='ZIMMAIN')

plt.legend()
plt.grid()
plt.xlabel('Wavelength [nm]')
plt.ylabel('Quantum efficiency')
plt.tight_layout()
plt.show()
Total running time of the script: (0 minutes 0.247 seconds)