Note
Go to the end to download the full example code.
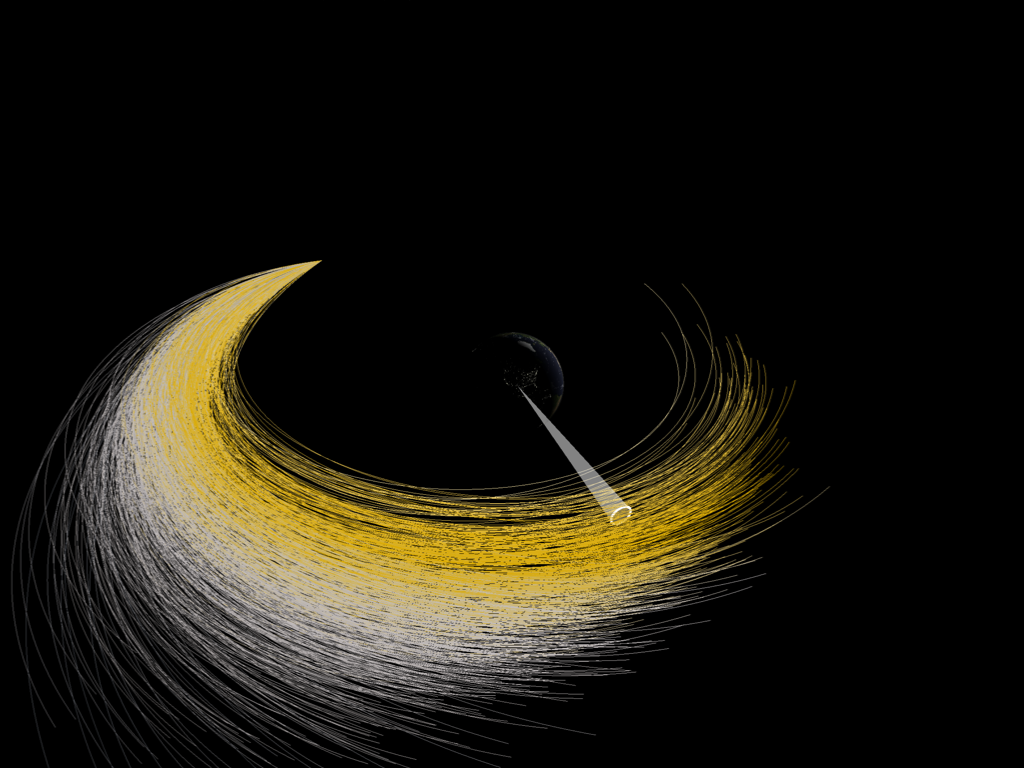
Cislunar Fragmentation#
Visualizing a fragmentation event (for fun)
import matplotlib.pyplot as plt
import numpy as np
import pyvista as pv
import taichi as ti
from matplotlib.colors import LinearSegmentedColormap

import mirage as mr
import mirage.vis as mrv

date = mr.utc(2023, 9, 22, 10)
dates, epsecs = mr.date_linspace(
    date, date + mr.hours(10), int(1e2), return_epsecs=True
)
station = mr.Station()
obj = mr.SpaceObject('cube.obj', identifier=44333)
r_sat, v_sat = obj.propagate(dates - mr.hours(10), return_velocity=True)

r0, v0 = r_sat[0], v_sat[0]

NICS = 1_000
dv = np.random.normal(0, scale=0.2, size=(NICS, 3))

r0p = np.tile(r0, (NICS, 1))
v0p = v0 + dv
s0p = np.hstack((r0p, v0p))
/Users/liamrobinson/Documents/maintained-research/mirage/mirage/orbit.py:503: UserWarning: Velocity is transformation is missing omega cross r term from TEME to J2000, but this is tiny
  warnings.warn(
Now let’s propagate the particles
ti.init(arch=ti.cpu)

NTIMES = epsecs.size
STYPE = ti.types.vector(6, dtype=ti.f32)
traj = ti.field(dtype=STYPE, shape=(NICS, NTIMES))

for i in range(NICS):
    traj[i, 0] = STYPE(s0p[i])


@ti.func
def two_body_dynamics(state) -> STYPE:
    r = state[:3].norm()
    dx, dy, dz = state[3], state[4], state[5]
    ddx = -mr.AstroConstants.earth_mu * state[0] / r**3
    ddy = -mr.AstroConstants.earth_mu * state[1] / r**3
    ddz = -mr.AstroConstants.earth_mu * state[2] / r**3
    return ti.Vector([dx, dy, dz, ddx, ddy, ddz])


@ti.func
def rk4_step(x0, h) -> STYPE:
    k1 = h * two_body_dynamics(x0)
    k2 = h * two_body_dynamics(x0 + k1 / 2)
    k3 = h * two_body_dynamics(x0 + k2 / 2)
    k4 = h * two_body_dynamics(x0 + k3)
    return x0 + k1 / 6 + k2 / 3 + k3 / 3 + k4 / 6


@ti.kernel
def compute_trajectory(h: ti.f32) -> int:
    for i in range(NICS):
        ti.loop_config(serialize=True)
        for j in range(NTIMES - 1):
            traj[i, j + 1] = rk4_step(traj[i, j], h)
    return 0


compute_trajectory(np.diff(epsecs[:2])[0])
traj = traj.to_numpy()

r_to_sat = traj[-1, -1, :3] - station.j2000_at_dates(date)
look_dir_eci = mr.hat(r_to_sat)

p = pv.Plotter()

mrv.plot_conic_sensor(
    p,
    station,
    date,
    look_dir_eci,
    half_angle_deg=3,
    extent=mr.vecnorm(r_to_sat),
    show_edges=True,
    color='white',
)

hex_colors = [
    '#EBD99F',  # Dust
    '#DDB945',  # Field
    '#DAAA00',  # Rush
    '#C4BFC0',  # Steam
    '#9D9795',  # Railway Gray
    '#6F727B',  # Cool Gray
    '#555960',  # Steel
]

rgb_colors = [plt.matplotlib.colors.to_rgb(c) for c in hex_colors]
cmap = LinearSegmentedColormap.from_list('purdue', rgb_colors, N=256)

for t in traj:
    mrv.plot3(
        p, t[:, :3], scalars=np.linalg.norm(t[0, 3:]), show_scalar_bar=True, cmap=cmap
    )

p.remove_scalar_bar()
mrv.plot_earth(p, date=date)
p.enable_anti_aliasing('msaa', multi_samples=16)

p.show()
[Taichi] Starting on arch=arm64
Total running time of the script: (0 minutes 5.128 seconds)