Note
Go to the end to download the full example code.
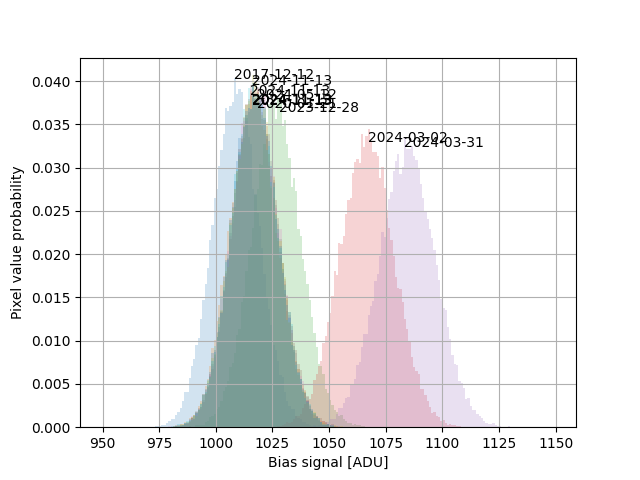
Bias Frames#
Characterizing the background bias of the POGS CCD
import datetime
import os
import matplotlib.pyplot as plt
import numpy as np
from astropy.io import fits
import mirage as mr
bias_frames_dir = (
'/Users/liamrobinson/Library/CloudStorage/OneDrive-purdue.edu/pogs/bias_frames'
)
bias_fit_paths = [
os.path.join(bias_frames_dir, x)
for x in os.listdir(bias_frames_dir)
if (('-20' in x or '_temp_' not in x) and 'bias' in x.lower())
]
region = [slice(200, 400), slice(200, 400)]
means = []
vars = []
dates = []
mins = []
temps = []
data_betweens = []
roi = (950, 1150)
hot_count = []
for bias_fit_path in bias_fit_paths:
with fits.open(bias_fit_path) as hdul:
data = hdul[0].data
dates.append(
datetime.datetime.strptime(
hdul[0].header['DATE-OBS'], '%Y-%m-%dT%H:%M:%S.%f'
).replace(tzinfo=datetime.timezone.utc)
)
bias_fit_paths = np.asarray(bias_fit_paths)[np.argsort(dates)]
dates = np.sort(dates)
for bias_fit_path in bias_fit_paths:
with fits.open(bias_fit_path) as hdul:
data = hdul[0].data
temps.append(hdul[0].header['SET-TEMP'])
# plt.imshow(data[region[0], region[1]])
# plt.show()
dataf = data[region[0], region[1]].flatten()
hot_pixels = dataf > roi[1]
dead_pixels = dataf < roi[0]
is_ok = ~hot_pixels & ~dead_pixels
data_betweens.append(dataf[is_ok])
hot_count.append(hot_pixels.sum())
mins.append(np.min(data))
means.append(np.mean(data_betweens[-1]))
vars.append(np.var(data_betweens[-1]))
mins = np.array(mins)
means = np.array(means)
vars = np.array(vars)
temps = np.array(temps)
epyr = (mr.date_to_jd(dates) - mr.date_to_jd(dates).min()) / 365.25
hot_count = np.array(hot_count)
plt.figure()
for date, data_between in zip(dates, data_betweens):
y, x = plt.hist(data_between, bins=range(roi[0], roi[1]), alpha=0.2, density=True)[
:2
]
y_text = y.max()
x_text = x[np.argmax(y)]
plt.text(x_text, y_text - np.random.rand() * y_text / 10, date.strftime('%Y-%m-%d'))
plt.xlabel('Bias signal [ADU]')
plt.ylabel('Pixel value probability')
plt.grid()
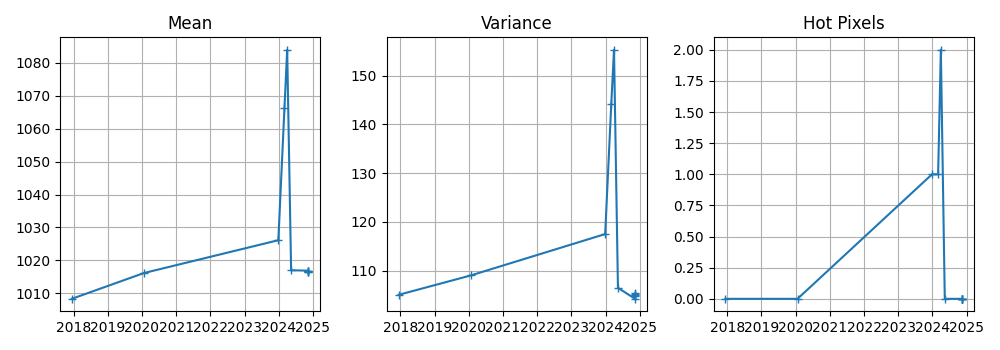
plt.figure(figsize=(10, 3.5))
plt.subplot(1, 3, 2)
plt.plot(dates, vars, marker='+')
plt.title('Variance')
plt.grid()
plt.subplot(1, 3, 1)
plt.plot(dates, means, marker='+')
plt.title('Mean')
plt.grid()
plt.subplot(1, 3, 3)
plt.plot(dates, hot_count, marker='+')
plt.title('Hot Pixels')
plt.grid()
plt.tight_layout()
plt.show()
Total running time of the script: (0 minutes 1.862 seconds)