Note
Go to the end to download the full example code.
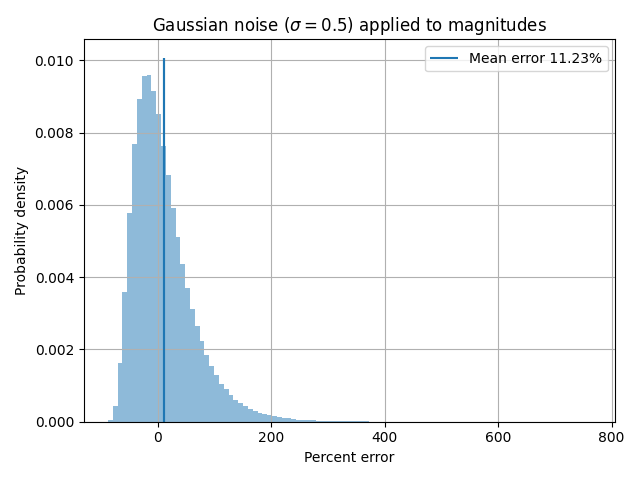
Noise Addition Methods#
Showing that adding noise directly to apparent magnitudes is a bad idea
/Users/liamrobinson/Documents/maintained-research/mirage/examples/01-light_curves/noise_crimes.py:28: SyntaxWarning: invalid escape sequence '\s'
  plt.title(f'Gaussian noise ($\sigma={sigma}$) applied to magnitudes')
The mean error percent is nonzero: 11.228438583890055
Notice that the median error is approximately zero: 0.004643586306424339
import matplotlib.pyplot as plt
import numpy as np

import mirage as mr

irrad = 1e-10 * np.ones(int(1e6))
m = mr.irradiance_to_apparent_magnitude(irrad)
sigma = 0.5

m += np.random.normal(loc=0 * m, scale=sigma)
irrad_m = mr.apparent_magnitude_to_irradiance(m)

err_m = (irrad_m - irrad) / irrad * 100
mir = np.mean(err_m)
print(f'The mean error percent is nonzero: {mir}')
print(f'Notice that the median error is approximately zero: {np.median(err_m)}')

plt.hist(err_m, bins=100, alpha=0.5, density=True)
plt.vlines([mir, mir], *plt.ylim(), label=f'Mean error {mir:.2f}%')
plt.xlabel('Percent error')
plt.title(f'Gaussian noise ($\sigma={sigma}$) applied to magnitudes')
plt.ylabel('Probability density')
plt.grid()
plt.legend()
plt.tight_layout()
plt.show()
Total running time of the script: (0 minutes 0.255 seconds)