Note
Go to the end to download the full example code.
Flat Fielding Error#
Investigating how the
import matplotlib.pyplot as plt
import numpy as np


def curve_for_k(mu_es: np.ndarray, k: float):
    adu_vars = []
    adu_meds = []
    for mu_e in mu_es:
        flat_field_effect = np.clip(
            np.random.normal(loc=mu_e, scale=k * mu_e), 0, np.inf
        )
        e_data = np.random.poisson(flat_field_effect)
        adu_data = e_data / g
        adu_vars.append(np.var(adu_data))
        adu_meds.append(np.median(adu_data))
    return np.array(adu_meds), np.array(adu_vars)


n = int(1e5)
mus_adu = np.tile(np.linspace(0, 4e5), (n, 1)).T
g = 5.6  # e- / ADU
mu_es = mus_adu * g
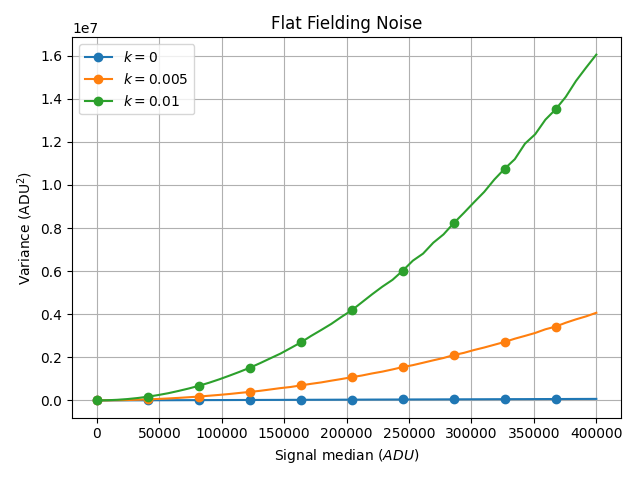
Plotting the growth in variance with the median
for k in [0, 0.005, 0.01]:
    adu_meds, adu_vars = curve_for_k(mu_es, k)
    plt.plot(adu_meds, adu_vars, label=f'${k=}$', marker='o', markevery=5)
plt.grid()
plt.ylabel(r'Variance ($\text{ADU}^2$)')
plt.xlabel('Signal median ($ADU$)')
plt.title('Flat Fielding Noise')
plt.legend()
plt.tight_layout()
plt.show()
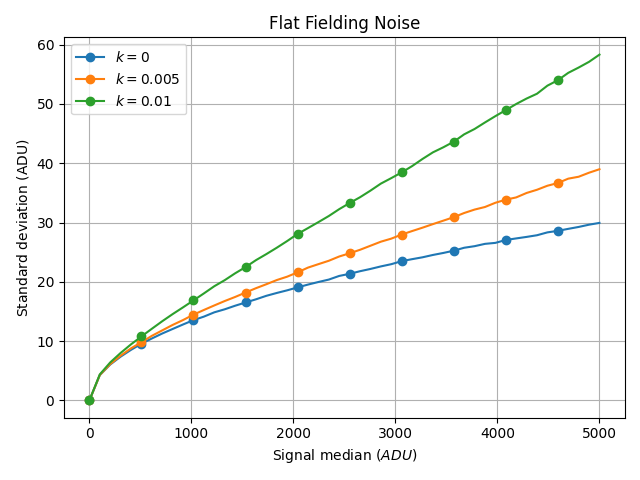
Plotting the growth in standard deviation with the median
n = int(1e5)
mus_adu = np.tile(np.linspace(0, 5e3), (n, 1)).T
g = 5.6  # e- / ADU
mu_es = mus_adu * g

for k in [0, 0.005, 0.01]:
    adu_meds, adu_vars = curve_for_k(mu_es, k)
    plt.plot(adu_meds, np.sqrt(adu_vars), label=f'${k=}$', marker='o', markevery=5)
plt.grid()
# plt.ylabel(r'Variance ($\text{ADU}^2$)')
plt.ylabel(r'Standard deviation ($\text{ADU}$)')
plt.xlabel('Signal median ($ADU$)')
plt.title('Flat Fielding Noise')
plt.legend()
plt.tight_layout()
plt.show()
Total running time of the script: (0 minutes 3.065 seconds)