Note
Go to the end to download the full example code.
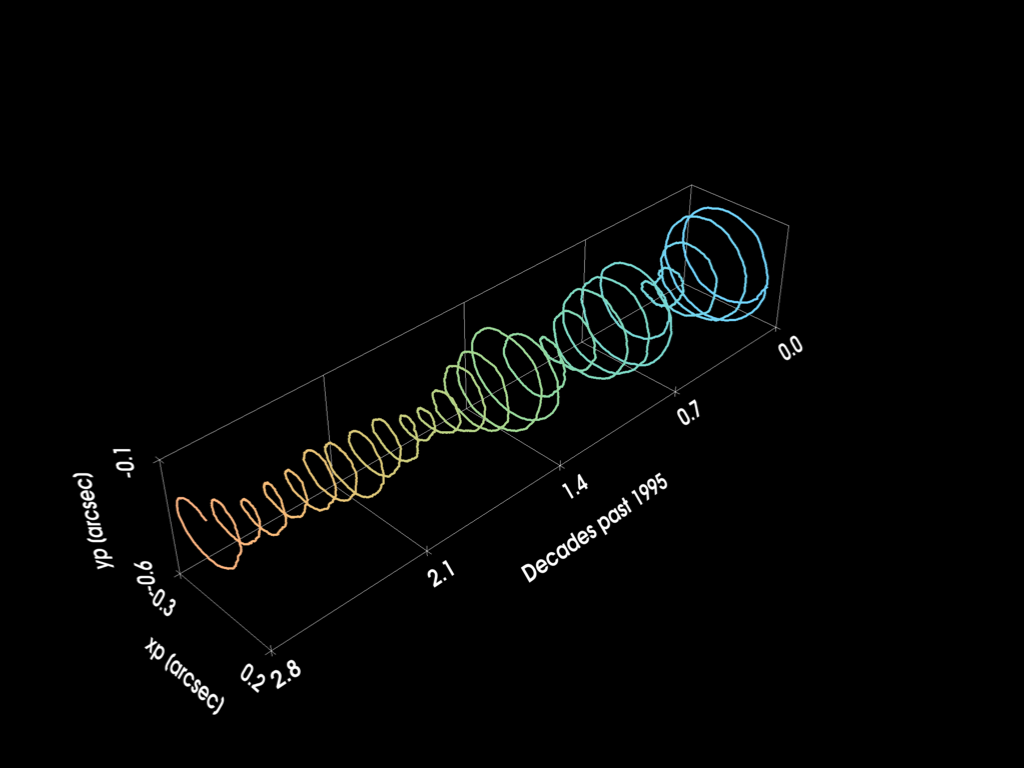
Polar Motion#
Plotting polar motion components \(x_p\) and \(y_p\) over the past ~3 decades
import numpy as np
import pyvista as pv

import mirage as mr
Let’s get the DCMS correcting for only polar motion over the past 3 decades
dates, epsecs = mr.date_linspace(
    mr.utc(1995, 1, 1), mr.utc(2023, 1, 1), 10000, return_epsecs=True
)
dt = epsecs / (mr.AstroConstants.earth_sec_in_day * 365.25)
dcms = mr.EarthFixedFrame('itrf', 'gtod').rotms_at_dates(dates)
xp, yp = (
    mr.AstroConstants.rad_to_arcsecond * dcms[0, 2, :],
    mr.AstroConstants.rad_to_arcsecond * dcms[2, 1, :],
)
We can plot things to see
pl = pv.Plotter()
lines = pv.MultipleLines(points=np.vstack((dt / 10, xp, yp)).T)
pl.add_mesh(lines, scalars=dt, line_width=5, cmap='isolum', show_scalar_bar=False)
pl.set_background('k')
pl.enable_anti_aliasing('ssaa')
pl.show_bounds(
    grid='back',
    location='outer',
    ticks='both',
    n_xlabels=5,
    n_ylabels=2,
    n_zlabels=2,
    xtitle='Decades past 1995',
    ytitle='xp [arcsec]',
    ztitle='yp [arcsec]',
    color='w',
)
pl.show()
Total running time of the script: (0 minutes 0.231 seconds)