Note
Go to the end to download the full example code.
Synthetic Image Results#
import matplotlib.pyplot as plt
import numpy as np
from matplotlib import colormaps as cm
from matplotlib import patches
from matplotlib.colors import SymLogNorm
import mirage.photo as mrp
import mirage.vis as mrv
# reg
def plot_results(
data: dict,
regions: list,
obs_title_postfix: str = None,
synth_title_postfix: str = None,
):
img = data['img'] # regen 3
img_syn = data['img_syn']
br_std_img = data['br_std_img']
# br_std_syn = data['br_std_synth']
clim = [
np.min([np.min(img), np.min(img_syn)]),
np.max([np.max(img), np.max(img_syn)]),
]
norm = SymLogNorm(1, 1, *clim)
p1 = plt.figure(figsize=(6.5, 5)) # noqa
p2 = plt.figure(figsize=(6.5, 5)) # noqa
plt.figure(1)
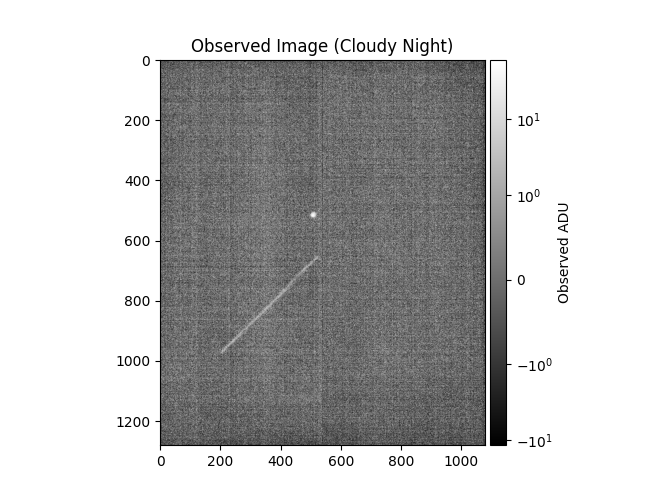
mrp.plot_fits(img, norm=norm)
otitle = 'Observed Image' + (
f' {obs_title_postfix}' if obs_title_postfix is not None else ''
)
plt.title(otitle)
plt.colorbar(label='Observed ADU', cax=mrv.get_cbar_ax())
for i, (r, c) in enumerate(regions, 1):
w, h = r[1][1] - r[1][0], r[0][0] - r[0][1]
for _i in range(1, 3):
plt.figure(_i)
rect1 = patches.Rectangle(
[np.mean(r[1]) - w / 2, np.mean(r[0]) - h / 2],
w,
h,
edgecolor=c,
fill=False,
lw=1.5,
label=f'R. {i}',
)
plt.gca().add_patch(rect1)
if len(regions):
plt.legend(bbox_to_anchor=(-0.34, 1), loc='upper left')
plt.figure(2)
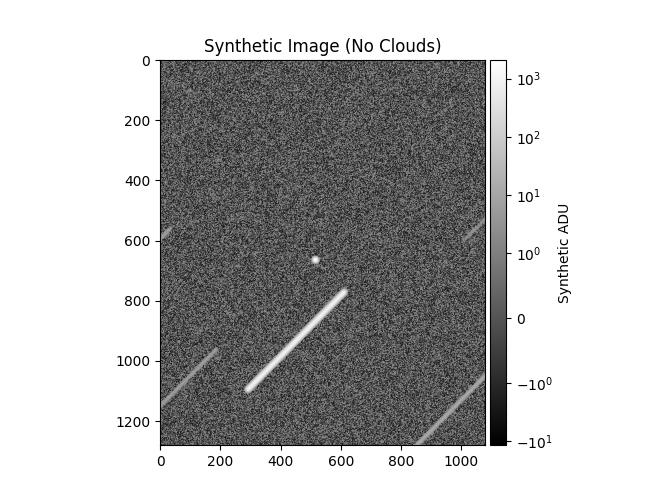
mrp.plot_fits(img_syn, norm=norm)
stitle = 'Synthetic Image' + (
f' {synth_title_postfix}' if synth_title_postfix is not None else ''
)
plt.title(stitle)
plt.colorbar(label='Synthetic ADU', cax=mrv.get_cbar_ax())
plt.show()
# %%
# Subtracting the two images
n_bins = 40
cmap = cm.get_cmap('plasma')
g = 5.1
adu_err = img_syn - img
br_mask = (
np.sqrt(np.abs(img) * g) / g < br_std_img
) # dominated by std of background
adu_err_stdev = np.zeros_like(adu_err)
adu_err_stdev[br_mask] = adu_err[br_mask] / br_std_img
sig_mask = ~br_mask
adu_err_stdev[sig_mask] = adu_err[sig_mask] / (
np.sqrt(np.abs(img[sig_mask])) / np.sqrt(g)
)
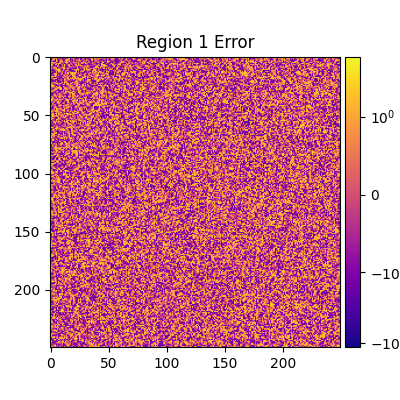
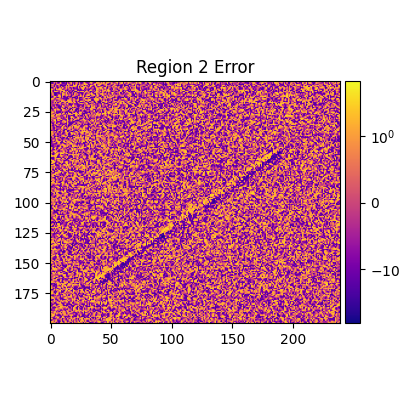
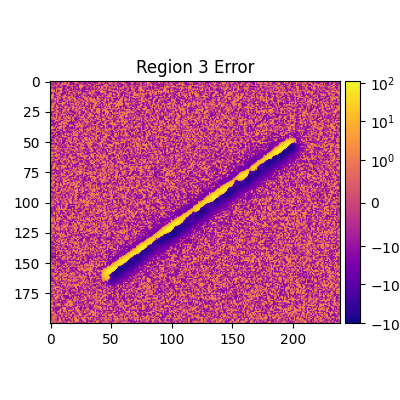
def plot_regions_error(rs, start):
for i, (r, c) in enumerate(rs, start):
adu_err_region = adu_err_stdev[r[0][1] : r[0][0], r[1][0] : r[1][1]]
err_range = (adu_err_region.min(), adu_err_region.max())
print(
f'Median error sigma for region {i}: {np.median(adu_err_region.flatten())}'
)
fiddy_percent_bounds = np.percentile(adu_err_region.flatten(), [25, 75])
print(f'{fiddy_percent_bounds=}')
plt.figure(figsize=(4, 4))
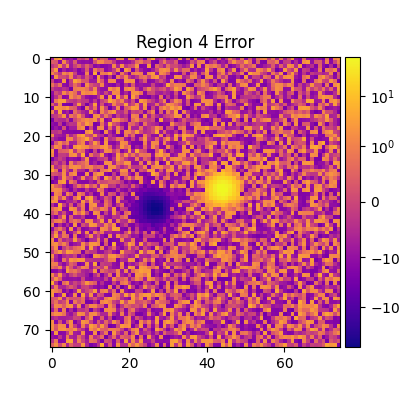
norm = SymLogNorm(1, 1, *err_range)
plt.title(f'Region {i} Error')
plt.imshow(adu_err_region, cmap=cmap, norm=norm)
plt.clim(*err_range)
# plt.xlabel('$x$ [pix]')
# plt.ylabel('$y$ [pix]')
plt.colorbar(label=r'ADU error $\sigma_\text{err}$', cax=mrv.get_cbar_ax())
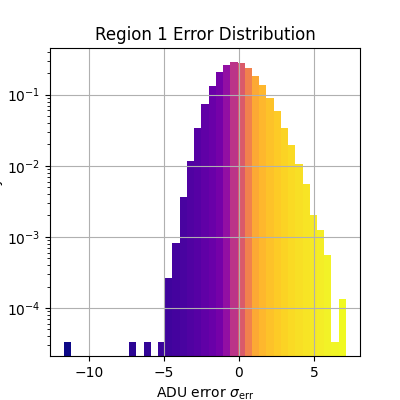
plt.figure(figsize=(4, 4))
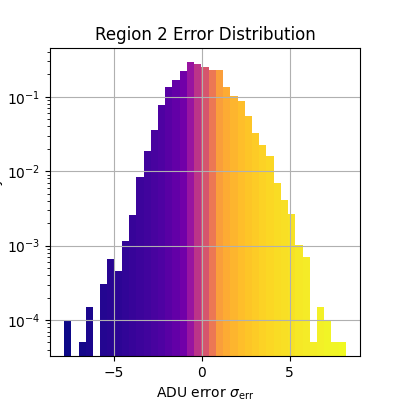
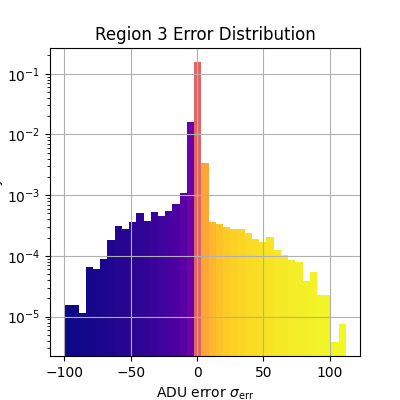
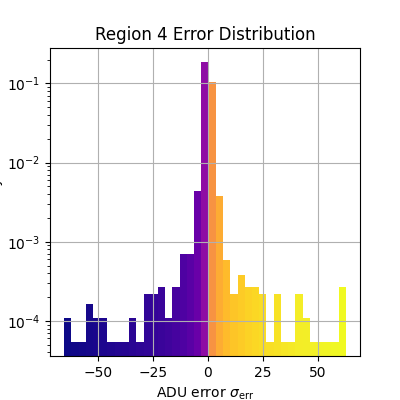
_, bins, patches = plt.hist(
adu_err_region.flatten(),
bins=np.linspace(*err_range, n_bins),
density=True,
)
bin_centers = 0.5 * (bins[:-1] + bins[1:])
for c, p in zip(bin_centers, patches):
plt.setp(p, 'facecolor', cmap(norm(c)))
plt.xlabel(r'ADU error $\sigma_\text{err}$')
plt.ylabel('Density')
plt.title(f'Region {i} Error Distribution')
plt.grid()
plt.yscale('log')
if len(regions):
plot_regions_error(regions[:2], 1)
if len(regions) > 2:
plot_regions_error(regions[2:], 3)
plt.show()
Plotting POGS results
data = np.load(
    '/Users/liamrobinson/Documents/maintained-research/mirage/examples/14-digital-twin-2024/data/pogs.nogit.npz'
)
r1 = [(3000, 2750), (3150, 3400)]  # br
r2 = [(750, 550), (250, 490)]  # dim star
r3 = [(1000, 800), (250, 490)]  # bright star
r4 = [(2025, 1950), (3000, 3075)]  # obj
regions = [(r1, 'r'), (r2, 'lime'), (r3, 'c'), (r4, 'm')]

print(f'{data["br_std_img"]=}, {data["br_std_synth"]=}')
plot_results(data, regions)
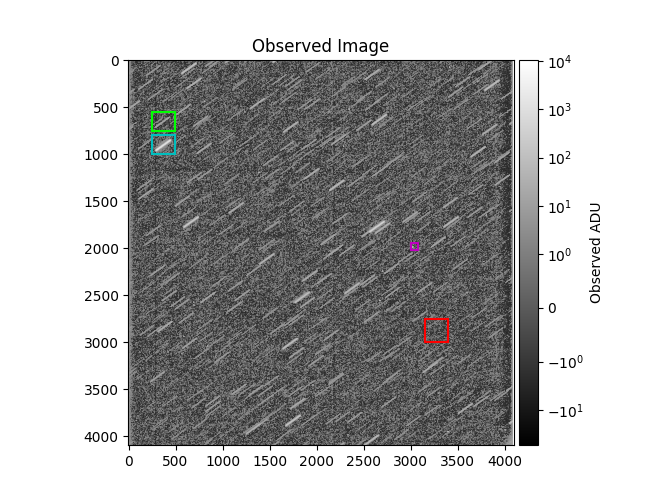
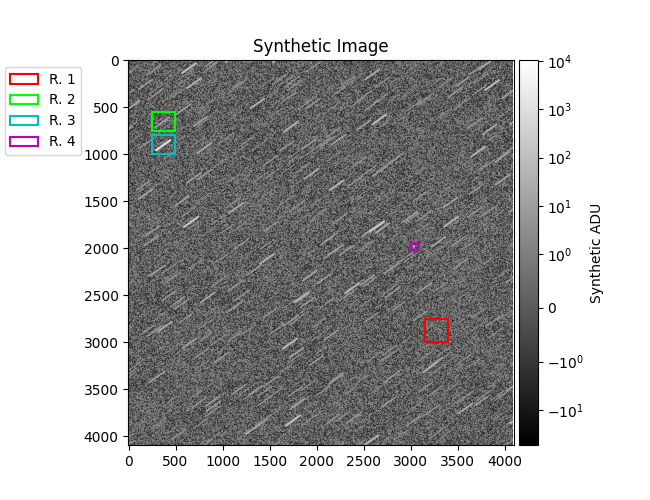
data["br_std_img"]=array(10.39386832), data["br_std_synth"]=array(8.65687165)
Median error sigma for region 1: -0.08515676614193557
fiddy_percent_bounds=array([-0.95832824,  0.95131815])
Median error sigma for region 2: -0.05604847776384868
fiddy_percent_bounds=array([-1.00556609,  0.91897236])
Median error sigma for region 3: -0.2267957862790211
fiddy_percent_bounds=array([-1.27827161,  0.83722067])
Median error sigma for region 4: -0.10729400541782001
fiddy_percent_bounds=array([-1.06903692,  0.95199798])
Plotting ZimMAIN results
data = np.load(
    '/Users/liamrobinson/Documents/maintained-research/mirage/examples/14-digital-twin-2024/data/zim.nogit.npz'
)
print(f'{data["br_std_img"]=}, {data["br_std_synth"]=}')

plot_results(
    data,
    [],
    obs_title_postfix='(Cloudy Night)',
    synth_title_postfix='(No Clouds)',
)

data["br_std_img"]=array(1.9459608), data["br_std_synth"]=array(2.93058066)
Plotting corrected ZimMAIN results
data = np.load(
    '/Users/liamrobinson/Documents/maintained-research/mirage/examples/14-digital-twin-2024/data/zim_corr.nogit.npz'
)

plot_results(
    data,
    [],
    obs_title_postfix='(Cloudy Night)',
    synth_title_postfix='(Cloud Corrected)',
)

Total running time of the script: (0 minutes 14.741 seconds)