Note
Go to the end to download the full example code.
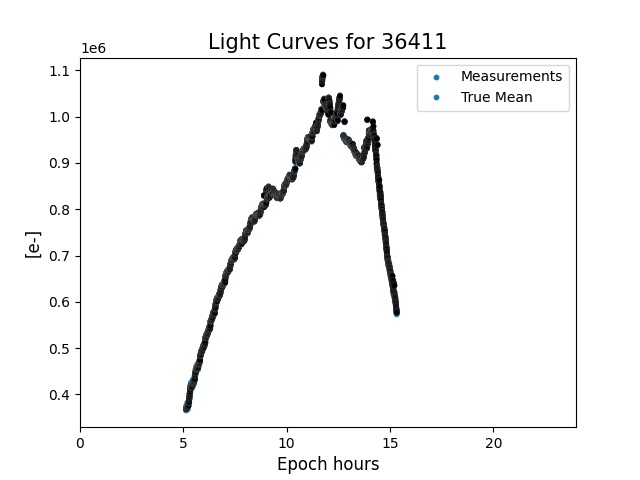
Noisy Light Curves#
Simulates torque-free rigid body motion for a simple object and computes the full light curve, informed by station constraints and a high-fidelity background signal model
import matplotlib.pyplot as plt
import numpy as np
import seaborn as sns

import mirage as mr
import mirage.vis as mrv
Setting up analysis times
date_start = mr.utc(2023, 5, 20, 20, 45, 0)
integration_time_s = 10.0
(dates, epsecs) = mr.date_arange(
    date_start - mr.days(1), date_start, mr.seconds(10), return_epsecs=True
)
ephr = epsecs / 3600  # Epoch hours
Setting up the scenario objects
obj = mr.SpaceObject('hylas4.obj', identifier='goes 15')
brdf = mr.Brdf('phong')
station = mr.Station(preset='pogs')
# Observing from the Purdue Optical Ground Station in New Mexico
Model file hylas4.obj not found in current model folder ('/Users/liamrobinson/Documents/maintained-research/mirage/mirage/resources/models'), checking model repository...
Attempting to download hylas4.obj and its associated material file from the model repository...
Requesting: https://raw.githubusercontent.com/ljrobins/mirage-models/main//accurate_sats/hylas4.obj
Model files were downloaded successfully!
Defining observation constraints on the station
station.constraints = [
    mr.SnrConstraint(3),
    mr.ElevationConstraint(10),
    mr.TargetIlluminatedConstraint(),
    mr.ObserverEclipseConstraint(station),
    mr.VisualMagnitudeConstraint(18),
    mr.MoonExclusionConstraint(10),
]
Defining the object’s attitude profile and mass properties
obj_attitude = mr.RbtfAttitude(
    w0=0.000 * np.array([0, 1, 1]),
    q0=mr.hat(np.array([0, 0, 0, 1])),
    itensor=obj.principal_itensor,
)
Computing the full noisy light curve
(lc_noisy_sampler, aux_data) = station.observe_light_curve(
    obj,
    obj_attitude,
    brdf,
    dates,
    integration_time_s=integration_time_s,
    use_engine=True,
)
lc_noisy = lc_noisy_sampler()
Extracting data and plotting results
lc_clean = aux_data['lc_clean']

sns.scatterplot(x=ephr, y=lc_noisy, linewidth=0.05, size=0.2)
sns.scatterplot(x=ephr, y=lc_clean, linewidth=0.05, size=0.2, color='k')
plt.xlim((0, np.max(ephr)))
mrv.texit(
    f'Light Curves for {obj.sat.satnum}',
    'Epoch hours',
    '[e-]',
    ['Measurements', 'True Mean'],
)
plt.grid()
plt.show()
Total running time of the script: (0 minutes 8.030 seconds)