Note
Go to the end to download the full example code.
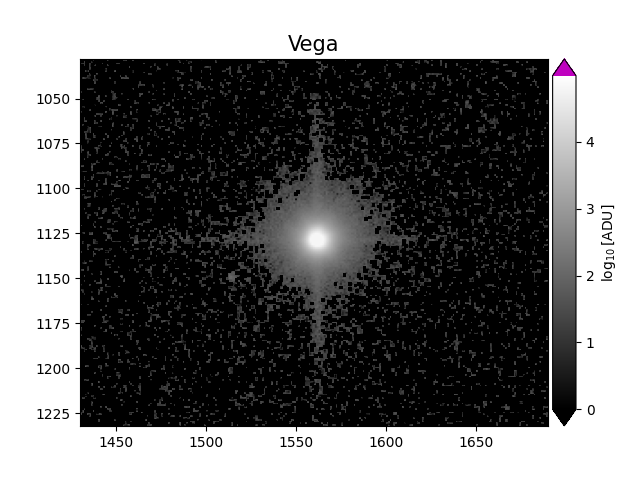
Vega PSF#
Plotting the point spread function of Vega
import matplotlib.pyplot as plt
import numpy as np
from matplotlib import colormaps

import mirage as mr
import mirage.vis as mrv

station = mr.Station()
catalog = mr.GaiaSpectralStarCatalog(station)
info = mr.info_from_fits(
    '/Users/liamrobinson/Library/CloudStorage/OneDrive-purdue.edu/pogs/data_cal_qe/00168954.Mouse_click_position.fit',
)

cmap = colormaps['gray']

plt.figure()
im = plt.imshow(np.log10(info['ccd_adu']), cmap=cmap)
im.set_clim(0, np.log10(station.telescope.ccd.full_well_capacity_adu - 2000))
im.cmap.set_bad('k')
im.cmap.set_over('m')

plt.xlim(1430, 1690)
plt.ylim(1232, 1028)
mrv.texit('Vega', '', '', grid=False)
plt.colorbar(
    cax=mrv.get_cbar_ax(), label=r'$\log_{10}\left[ \text{ADU} \right]$', extend='both'
)
# plt.show()
<matplotlib.colorbar.Colorbar object at 0x31b0a1580>
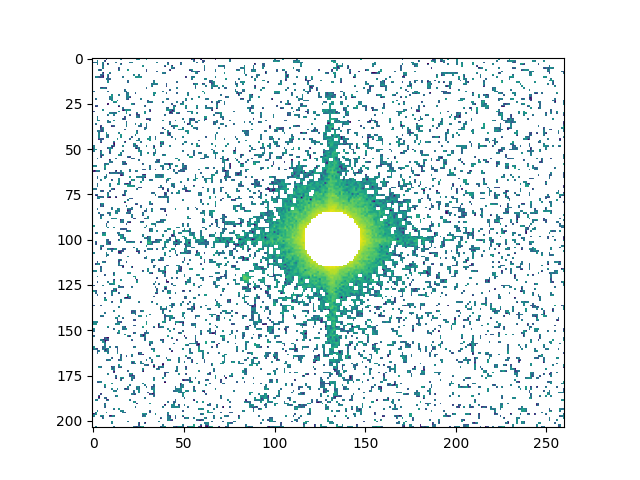
Let’s mask out the central portion of the signal
image = info['ccd_adu'][1028:1232, 1430:1690].astype(np.float64)
xx, yy = np.meshgrid(
    np.arange(image.shape[0]), np.arange(image.shape[1]), indexing='ij'
)
max_coords = np.round(
    [np.sum(xx * image / np.sum(image)), np.sum(yy * image / np.sum(image))]
).astype(int)
r = np.sqrt((xx - max_coords[0]) ** 2 + (yy - max_coords[1]) ** 2)
image = np.ma.array(image, mask=r < 15)

plt.figure()
plt.imshow(np.log10(image))
plt.show()
Total running time of the script: (0 minutes 2.367 seconds)