Note
Go to the end to download the full example code.
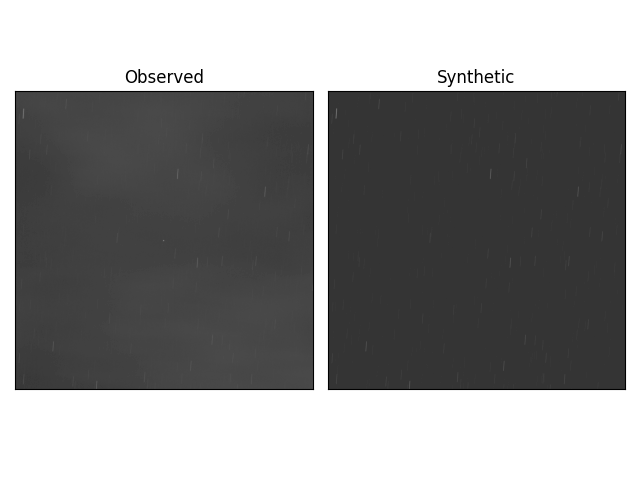
Digital Twin Animated#
An animated gif of the real and simulated images taken by POGS
Loading star catalog: 1.70e+00 seconds
Applying 1.31e-02 deg of refraction
fits_info["integration_time"]=3.462
sim counts are too high by a factor of 1.03
BEFORE QUEST: median error 56.11 pixels
Performing the QUEST fit with 141 stars
Applying a 1.80e-02 degree rotation to the telescope orientation
AFTER QUEST: median error 1.01 pixels
NO OBJECTS IN FRAME
Synthesizing CCD Image: 1.61e+00 seconds
import matplotlib.pyplot as plt
import numpy as np

import mirage as mr

# info_path = "/Users/liamrobinson/Library/CloudStorage/OneDrive-purdue.edu/2022-09-18_GPS_PRN14/ObservationData.mat"
# info_path = '/Users/liamrobinson/Library/CloudStorage/OneDrive-purdue.edu/2023-05-29 Telstar 19V/ObservationData.mat'
info_path = '/Users/liamrobinson/Library/CloudStorage/OneDrive-purdue.edu/pogs/2023-07-30/ObservationData.mat'

add_distortion = True
add_refraction = True
station = mr.Station(preset='pogs')
station.telescope.gain = 5.1
station.telescope.fwhm = 3.0
mr.tic('Loading star catalog')
catalog = mr.GaiaStarCatalog(station, mr.now() - mr.years(1))
mr.toc()

fig = plt.figure()
plt.subplot(1, 2, 1)
im_obs = plt.imshow(np.eye(4096), cmap='gray')
plt.gca().get_xaxis().set_visible(False)
plt.gca().get_yaxis().set_visible(False)
plt.title('Observed')
plt.subplot(1, 2, 2)
im_synth = plt.imshow(np.eye(4096), cmap='gray')
plt.title('Synthetic')
plt.gca().get_xaxis().set_visible(False)
plt.gca().get_yaxis().set_visible(False)
plt.tight_layout()

i = 100
res = mr.generate_matched_image(
    info_path,
    i,
    station,
    catalog,
    add_distortion,
    add_refraction,
    bias_variance=175,
    noise=True,
)
img_synth = np.log10(np.clip(res['img_sym'], 1, np.inf))
img = np.log10(np.clip(res['img'] - int(1e3), 1, np.inf))

plt.subplot(1, 2, 1)
im_obs.set_data(img)
plt.clim(img.min(), img.max())
plt.subplot(1, 2, 2)
im_synth.set_data(img_synth)
plt.clim(img.min(), img.max())
plt.show()
Total running time of the script: (0 minutes 8.989 seconds)