Note
Go to the end to download the full example code.
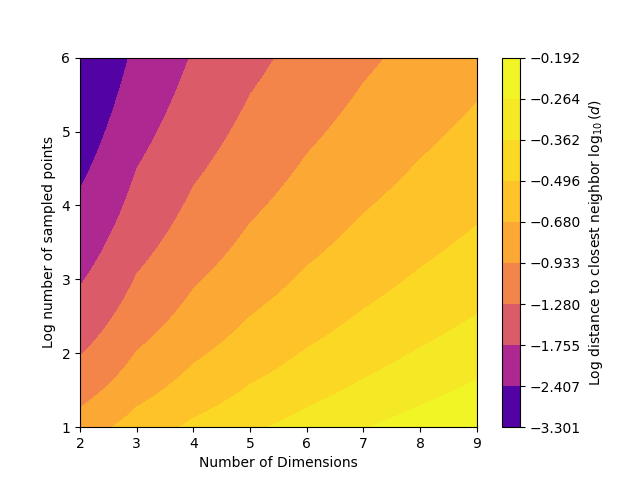
Closest Average Random Nearest Neighbor#
Using a method from [BC03] to find the mean distance to the kth nearest neighbor for uniformly scattered points in n-dimensions
expect: 0.009375
got: 0.005037
expect: 0.04
got: 0.02616
expect: 0.08552
got: 0.06297
expect: 0.1378
got: 0.1091
expect: 0.1921
got: 0.1623
expect: 0.2462
got: 0.2172
expect: 0.2988
got: 0.275
expect: 0.3496
got: 0.331
expect: 0.3984
got: 0.3874
expect: 0.4451
got: 0.4444
import matplotlib.pyplot as plt
import numpy as np
from sklearn.neighbors import BallTree
import mirage as mr
def dist_to_nearest_neighbor(pts: np.ndarray) -> np.ndarray:
nn_ind = BallTree(pts).query(pts, k=2)[1][:, 1]
return mr.vecnorm(pts - pts[nn_ind, :])
def uniform_pts_expected_distance_to_nn(
d: np.ndarray, n: np.ndarray, k: np.ndarray
) -> np.ndarray:
from scipy.special import gamma
t1 = gamma(d / 2 + 1) ** (1 / d) / np.pi**0.5
t2 = gamma(k + 1 / d) / gamma(k)
t3 = (1 / n) ** (1 / d)
rn = t1 * t2 * t3
return rn
ds = np.arange(2, 10)
ns = np.geomspace(10**1, 10**6, 100)
k = 1
dd, nn = np.meshgrid(ds, ns)
zs = np.log10(uniform_pts_expected_distance_to_nn(dd, nn, k))
# plt.gca().set_aspect()
levels = np.geomspace(zs.min(), zs.max(), 10)
plt.contourf(ds, np.log10(ns), zs, levels=levels, cmap='plasma')
plt.colorbar(label='Log distance to closest neighbor $\log_{10}(d)$')
plt.xlabel('Number of Dimensions')
plt.ylabel('Log number of sampled points')
plt.show()
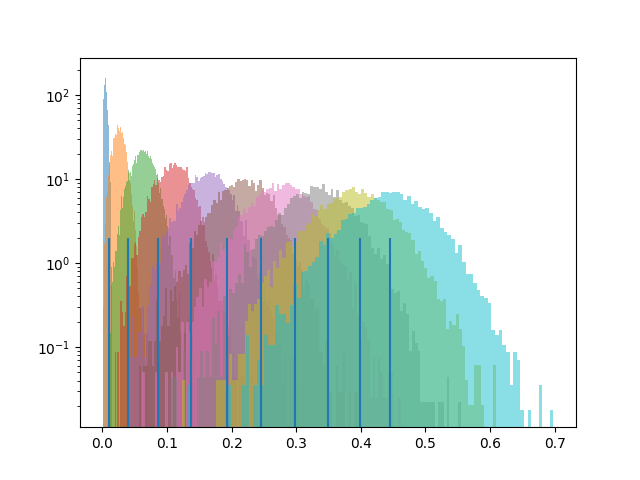
plt.figure()
npts = int(1e4)
for ndim in range(2, 12):
rn = uniform_pts_expected_distance_to_nn(ndim, npts, k=3)
x = np.random.rand(npts, ndim)
dn = dist_to_nearest_neighbor(x)
plt.hist(dn, log=True, bins=100, alpha=0.5, density=True)
plt.vlines(rn, 0, 2)
print(f'expect: {rn:.4}')
print(f'got: {np.mean(dn):.4}')
# plt.xscale('log')
plt.show()
Total running time of the script: (0 minutes 3.195 seconds)